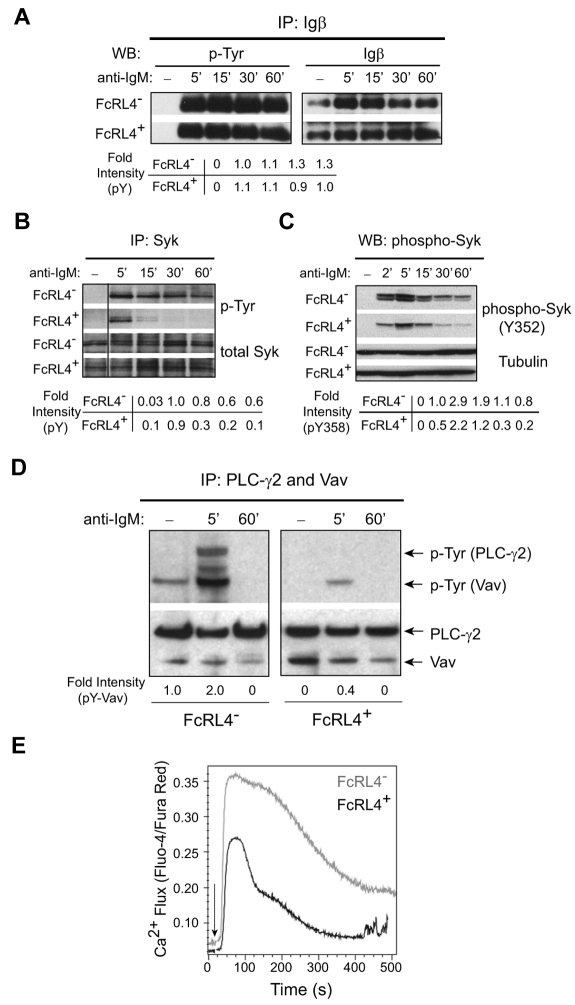
Figure 3.
FcRL4 expression inhibits BCR signaling downstream of Syk. (A-B) FcRL4− and FcRL4+ B cells (1 × 10⁷) were incubated in the absence or presence of F(ab′)2 anti-IgM (10 μg/mL) for the indicated times at 37°C to cross-link the BCR and the cells were lysed in detergent buffer. The lysate was immunoprecipitated with Igβ- (A) or Syk- (B) specific Abs, and the immunoprecipitates were subjected to SDS-PAGE and immunoblotting. Immunoblots were first probed with a mAb specific for phospho-tyrosine, and the blots were stripped and probed with Abs specific for either Igβ (A) or Syk (B). The phosphorylated protein (pY) immunoblots were quantified by densitometry and normalized to the total amount of Igβ or Syk. The fold intensities of at each time point relative to the pY intensity of FcRL4− cells 5 minutes after BCR cross-linking are given. Shown are representative blots of 3 independent experiments. The vertical line has been inserted to indicate a repositioned gel lane. (C) Whole-cell lysates from cells treated as in panels A and B were subjected to SDS-PAGE and immunoblotting, first with Ab specific for the phospho-tyrosine at residue 352 (pY352) of Syk and then Ab specific for tubulin. Shown is the representative of 2 independent experiments. The fold intensity of pY352 relative to pY352 of FcRL4− cells 2 minutes after BCR cross-linking is shown. (D) Cell lysates were sequentially immunoprecipitated for Vav and PLC-γ2, and both immunoprecipitates were combined and subjected to SDS-PAGE and immunoblotting, first with phospho-tyrosine–specific Abs and then with a mixture of Abs specific for Vav and PLC-γ2. The fold intensities of phospho-Vav (pY-Vav) relative to pY-Vav of FcRL4− cells 5 minutes after BCR cross-linking are given. Shown is 1 of 3 independent experiments. (E) Intracellular free Ca2+ was measured by flow cytometry after loading cells with Fluo-4NW and Fura Red at 37°C for 30 minutes. F(ab′)2 anti-IgM was added to the cells to cross-link the BCR and data acquisition was started 30 seconds later. Fluorescence intensities of Fluo-4 and Fura Red were recorded in FL-1 and FL-3, respectively, for 512 seconds. Shown is the ratio of the fluorescence intensities of Fluo-4 to Fura Red versus time (in seconds) from 1 of 5 independent experiments. The arrow indicates the time at which the F(ab′)2 anti-IgM was added to the cells.

