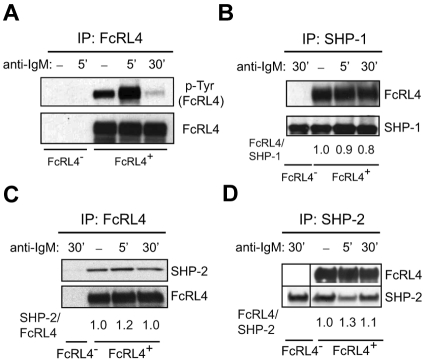
Figure 6.
The phosphorylation of FcRL4 and its association of SHP-1 and SHP-2. FcRL4− and FcRL4+ cells (5 × 10⁷ cells) were incubated with control nonspecific F(ab′)2 Ig or F(ab′)2 anti-IgM to cross-link BCR for 5 or 30 minutes and the cells lysed. (A) The cell lysates were immunoprecipitated using a GFP-specific Ab to capture FcRL4-YFP. Immunoprecipitates were subjected to SDS-PAGE and immunoblotting. Immunoblots were probed with a phospho-tyrosine–specific Ab. The blots were stripped and reprobed with Abs specific for FcRL4. (B) The cell lysates were immunoprecipitated with Abs specific for SHP-1. After SDS-PAGE and immunoblotting, immunoblots were probed with Abs specific for FcRL4. The blots were stripped and reprobed with a mAb specific for SHP-1. The bands were quantified by densitometry and given are the fold intensities of FcRL4 relative to the SHP-1, with the ratio of FcRL4/SHP-1 for the control Ig cross-linking of FcRL4+ cells being 1. Each blot shown is from 1 representative experiment of 3 independent experiments. (C-D) The cell lysates were immunoprecipitated using a GFP-specific Ab and after SDS-PAGE and immunoblotting, the immunoblots were probed with Abs specific for SHP-2. The blots were stripped and probed with Ab specific for GFP (C). Alternatively, lysates were immunoprecipitated with Ab specific for SHP-2 and immunoblots were probed with Abs specific for FcRL4 (D). The blots were stripped and reprobed with Abs specific for SHP-2. Given are the fold intensities of either SHP-2 relative to the FcRL4 with the ratio of SHP-2/FcRL4 for the control Ig cross-linking of FcRL4+ cells being 1 (C) or FcRL4 relative to the SHP-2 with the ratio of FcRL4/SHP-2 for the control Ig cross-linking of FcRL4+ cells being 1 (D). In panel D, band from 30′ BCR cross-linking of FcRL4− cells was reordered from back to the front after scanning the image from the same film.

