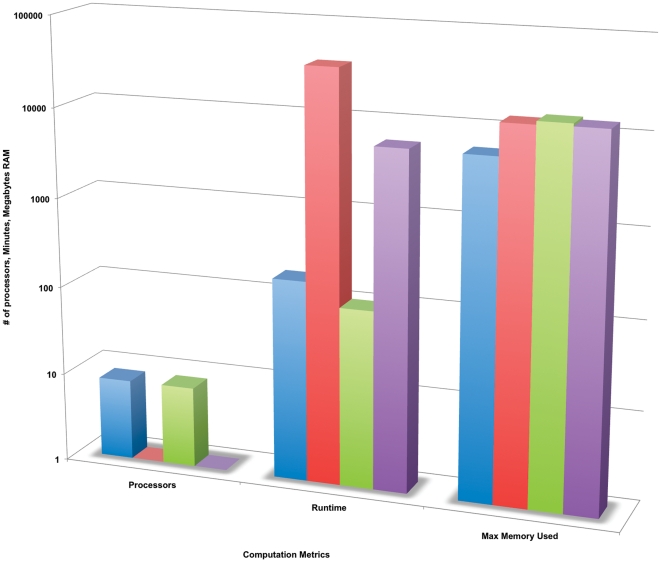
Figure 1. Computation metric values are presented for 4 different assemblies, each from a different sequencing platform/assembler combination, but created from similar datasets.
All datasets had a total coverage of 40× for rice chromosome one. Key: blue – 500 bp 454 reads, 16× coverage 2000 bp insert spacing with 24× coverage 8000 bp insert spacing, assembled with Newbler; red – 16× coverage 500 bp 454 fragment reads with 24× coverage, 75 bp Illumina reads with 8000 bp insert spacing, assembled with ABySS; green – 16× coverage 75 bp Illumina reads with 2000 bp insert spacing, 24× coverage 75 bp Illumina reads with 8000 bp insert spacing, assembled with ABySS; purple – 16× coverage 75 bp Illumina reads with 2000 bp insert spacing, 24× coverage 75 bp Illumina reads with 8000 bp insert spacing, assembled with Soapdenovo. Metric values were recorded during the assembly process.

