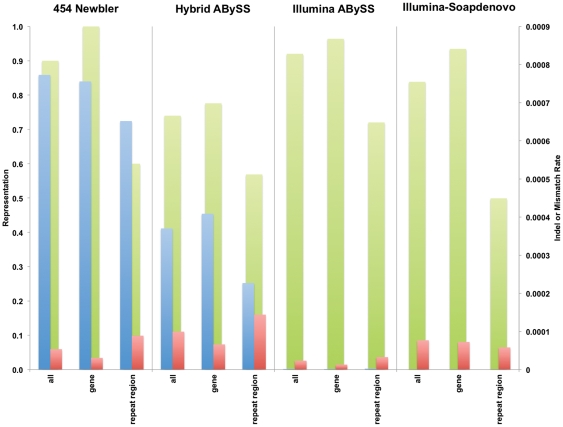
Figure 3. Fidelity metrics were derived by comparing the assemblies against the original genome sequence by alignment.
Mean values are presented for representation, indel rate, and mismatch rate for each of the platform/assembler combinations used for the rice chromosome one studies. Key: green – mean representation; blue – mean indel rate; red – mean mismatch rate.

