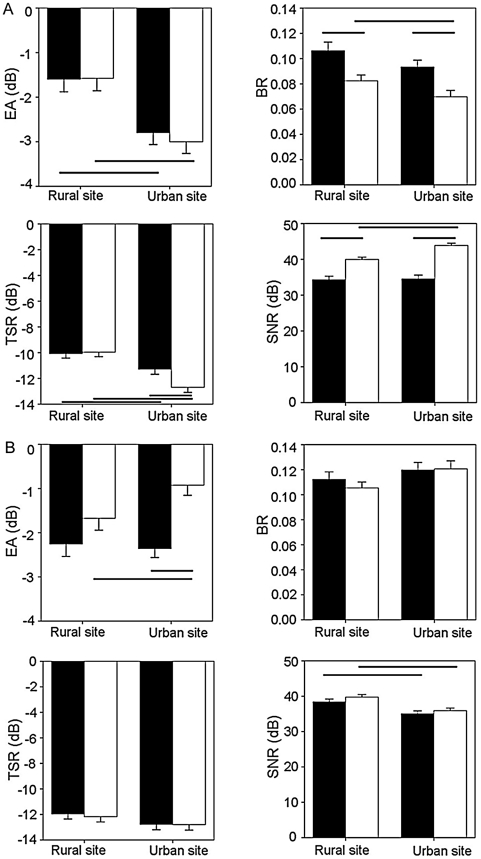
Figure 2. Effect of song and site on the four degradation measures.
(a) experiment 1, rural and true urban song and (b) experiment 2, rural and artificial urban song. Black bars are rural song, white bars are urban song. Error bars denote one standard error of the mean. Significant differences are indicated with black lines below (EA: Excess attenuation and TSR: Tail-to-signal ratio) and above (BR: Blur ratio and SNR: Signal-to-noise ratio) the bars. The measures of EA are negative as a result of the model sounds being recorded at a lower amplitude, yet as the error was consistent across all results, rural and urban measurements are directly comparable.

