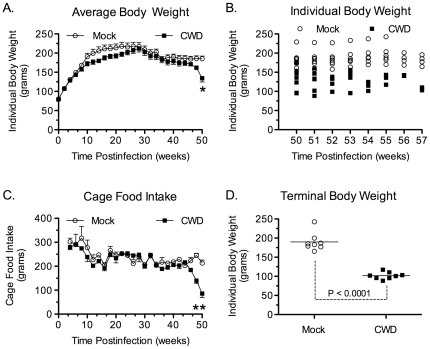
Figure 1. Time course of body weight and food intake in Syrian golden hamsters infected with chronic wasting disease.
Mock infected (○) and CWD infected hamsters (▪) (see Table 1, recipient group H1572) were monitored weekly over the course of infection for individual body weight (A, B), cage food intake (C), and individual body weight at sacrifice (D). Values in panels (A) and (C) are the mean ± standard error of the mean, while in panels (B) and (D) the body weight is for individual SGH with the mean indicated by the solid horizontal bar (D). For time course data in (A) and (C), the curves for mock infected and CWD infected hamsters were compared by a mixed model ANOVA. In cases of a significant interaction, post hoc comparisons at each weekly time point were conducted using t-tests (corrected Bonferroni's t-test, * indicates p<0.001). Hamsters (n = 8 per treatment group) were sacrificed between 50 and 58 weeks post-inoculation (B). For illustration purposes (A, C), data points are plotted for every other week.

