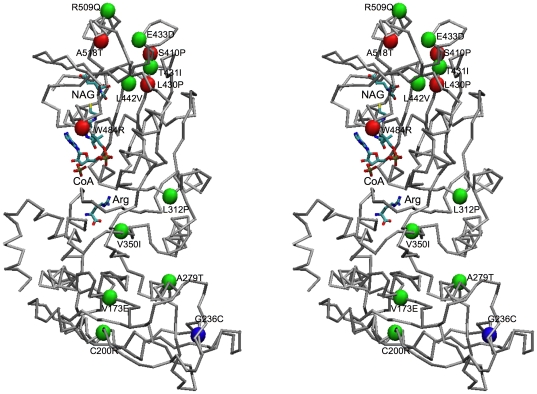
Figure 7. Structural model of human NAGS shown in stereo view as a Cα-trace.
Modeled bound arginine, CoA and NAG are shown in stick mode. The Cα atoms of residues with missense mutations identified in NAGS deficient patients are shown as red (neonatal onset – severe phenotype) or green (late onset – mild phenotype) or blue (unknown onset) spheres.

