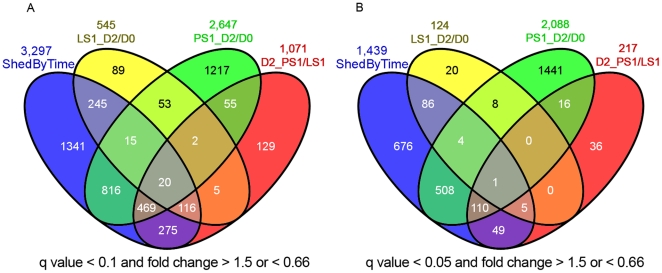
Figure 2. Summary of differentially expressed transcripts responding to inoculation (d2/d0), differential expression between the two shedding classes at 2 dpi (PS1/PS2), or expression showing shedding class by time interaction (Shed By Time).
These genes were identified using the linear mixed model, and the false discovery rate was controlled at q less than 0.1 (Fig. 2A) or less than 0.05 (Fig. 2B), with the fold change between treatments required to be higher than 1.5 or less than 0.66 (comparing LS1 2 dpi versus 0 dpi, PS1 2 dpi versus 0 dpi, or PS1 versus LS1 at 2 dpi).

