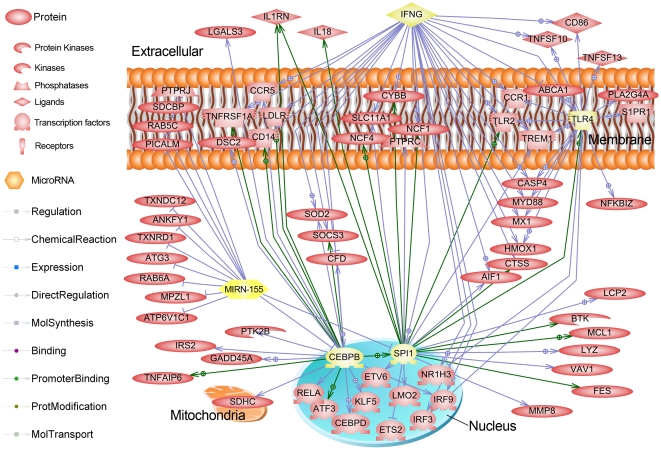
Figure 8. Common gene interactions of the IFNG, SPI1, TLR4, CEBPB and mir-155 (highlighted with yellow) gene expression regulation networks for up-regulated genes in the PS animals.
In this figure, all entity relationships (protein-protein binding, promoter binding by transcription factor, known regulatory relationship, and other relationships) are shown for all up-regulated genes in the PS animals that were shown to be regulated by one of these five genes in the Sub-Network Enrichment Analysis. Green lines indicate promoter binding evidence; blue lines indicate regulation evidence only; all links reported by PubMed literature were obtained using Pathway Studio® (Ariadne). Note the large number of genes in common among the IFNG, SPI1 and CEBPB regulons, as well as that miR-155 negatively regulates both SPI1 and CEBPB.

