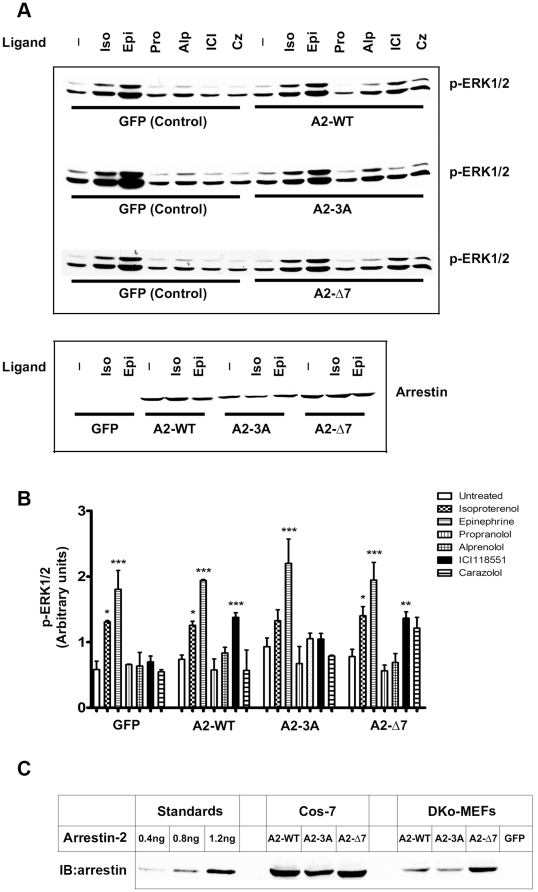
Figure 8. ERK2 activation by different β2AR ligands in DKO MEFs.
A. DKO MEFs were infected with retrovirus encoding GFP, untagged WT arrestin-2 (A2-WT), arrestin-2-3A (A2-3A), or arrestin-2-Δ7 (A2-Δ7). Serum-starved cells were stimulated with indicated β2AR ligands, lysed, and analyzed by Western blot. Representative blots are shown. The expression of different forms of arrestin-2 is compared in the blot below. B. Phospho-ERK1/2 bands were quantified. Means ± SD of 3 independent experiments are shown. C. Comparison of arrestin expression levels in COS-7 cells (5 µg protein/lane) and DKO MEFs (10 µg protein/lane) was performed by Western blot with anti-arrestin antibody. Standards containing indicated amounts of purified arrestin-2 were run along with cell lysates to generate calibration curve. Arrestin expression was measured by quantitative Western in COS-7 cells: A2-WT, 100.1 pmol/mg; A2-3A, 81.1 pmol/mg; A2-Δ7, 92.8 pmol/mg. Arrestin expression in DKO MEFs was much lower: A2-WT, 13.2 pmol/mg; A2-3A, 12.3 pmol/mg; A2-Δ7, 21.7 pmol/mg.

