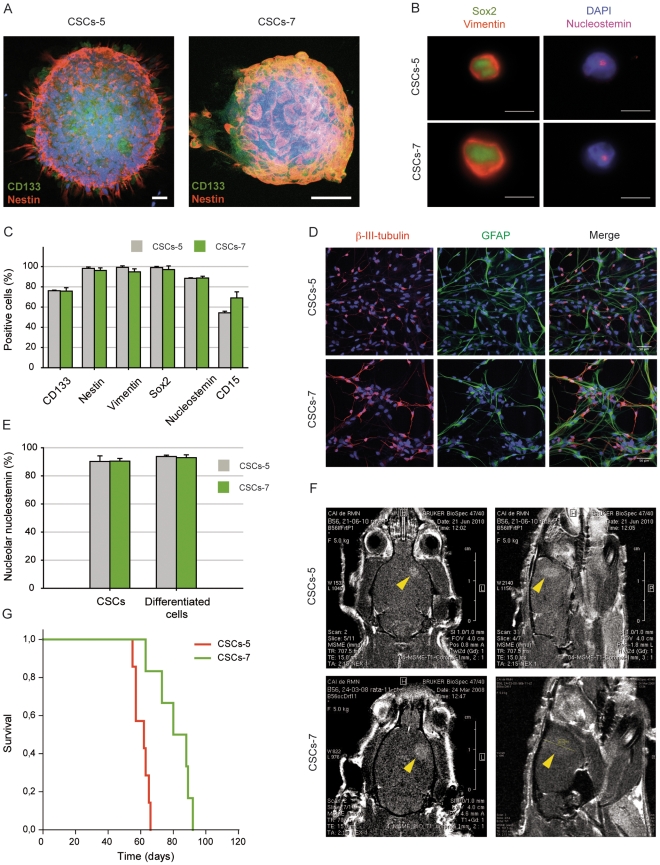
Figure 1. CSCs-5 and CSCs-7 characterization.
A. CSCs-5 and CSCs-7 neurospheres expressing CD133 (green) and nestin (red). Scalebar: 50 µm. B. CSCs-5 and CSCs-7 cells showing the expression and cellular localization of Sox2 (green), vimentin (red) and nucleostemin (purple). Scalebar: 10 µm, and quantitative plot (C) of the stem cell markers CD133, nestin, vimentin, Sox2, nucleostemin and CD15 in CSCs-5 (gray) and CSCs-7 (green). D. Neuron (β-III-tubulin, pink-red) and astrocytic (GFAP, green) differentiation capacity of CSCs-5 and CSCs-7. Scalebar: 50 µm. E. Nucleolar nucleostemin expression in stem or differentiatiated CSCs-5 (gray) and CSCs-7 (green) cells. F. Magnetic resonance imaging of in vivo tumors developed from CSCs-5 and CSCs-7 (yellow arrowheads point to the tumor), and Kaplan-Meier survival analysis (G) of immunodeficent rats, after CSCs-5 (red) or CSC-7 (green) orthotopic xenografts.

