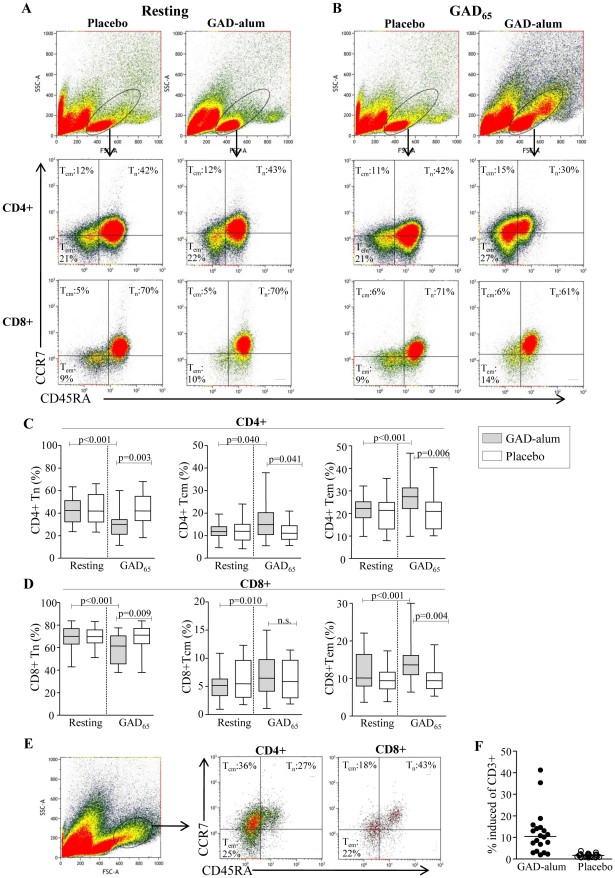
Figure 1. Frequencies of naïve, central memory and effector memory CD4+ and CD8+ T cells.
(A-B)Representative flow cytometry analysis from one placebo- and one GAD-alum-treated-patient assessed in resting and GAD65-stimulated PBMC cultures. The gate was set to include both small and large lymphocytes. Median percentages of naïve (CD45RA+CCR7+;Tn), central memory (CD45RA-CCR7+;TCM) and effector memory (CD45RA-CCR7 -;TEM) CD4+ and CD8+ T cells are indicated in each plot. (C–D) Frequencies of naïve (Tn), central memory (TCM) and effector memory (TEM) CD4+ and CD8+ T cells, assessed in resting and GAD65-stimulated PBMC cultures from GAD-alum- (n = 20) and placebo-treated patients (n = 23). Box plots represents median and range, significant differences are indicated as p-values. (E) Representative dot plot of the GAD65-induced cell subset with higher SSC and FSC evident only in GAD-alum-treated patients. Median percentages of naïve and memory CD4+ and CD8+ subsets are indicated in each plot. (F) Frequency of CD3+ cells that occupied the induced cell subset. Horizontal line represent median.

