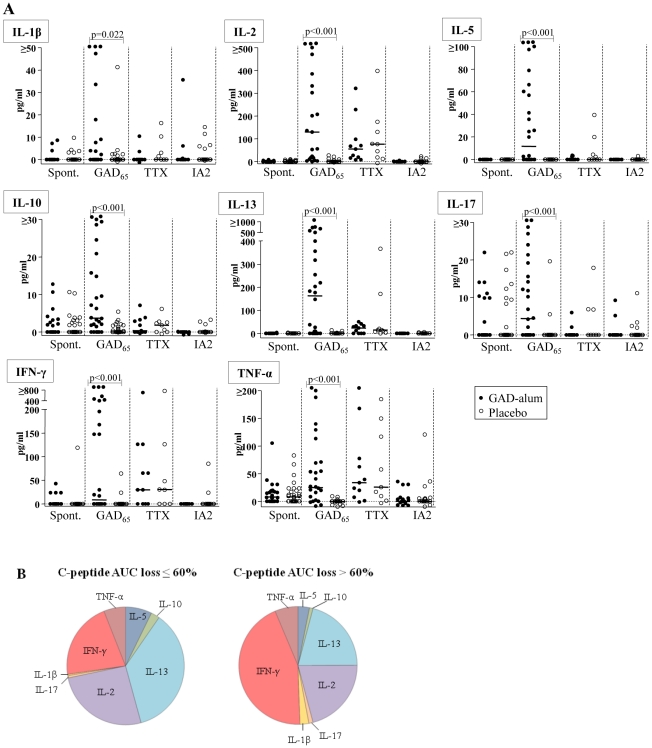
Figure 3. Cytokine secretion upon in vitro PBMC stimulation.
(A) Spontaneous, and GAD65-, TTX- and IA-2853–872-induced IL-1β, IL-2, IL-5, IL-10, IL-13, IL-17, IFN-γ and TNF secretion (pg/ml), detected by Luminex in PBMC supernatants after 72 hour culture, from GAD-alum- (black circles; n = 28) and placebo-treated patients (white circles; n = 29). Antigen-induced cytokine secretion is given after subtraction of spontaneous secretion. Horizontal lines represent medians. Significant differences are indicated as p-values. (B) Cytokine profiles in GAD-alum patients with a loss of C-peptide AUC <60% (n = 5), or a loss of C-peptide AUC >60% (n = 16). Pie chart illustrates the relative contribution of each cytokine to the GAD65-induced secretion detected by Luminex.

