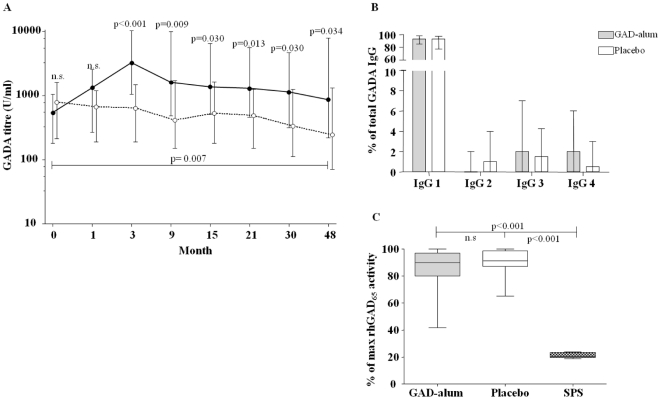
Figure 5. Serum GADA levels, GADA IgG1-4 subclass distribution and GAD65 enzymatic activity.
(A) Serum GADA titres (U/ml; median and interquartile range) from baseline to 4 years, in GAD-alum treated patients (filled symbols, n = 29) and in placebo (open symbols, n = 30). (B) Serum GADA IgG 1–4 subclass distribution (median and range), expressed as a percentage of total GADA IgG in GAD-alum- and placebo groups. (C) Recombinant human GAD65 enzymatic activity measured in the presence of serum from GAD-alum- and placebo-treated patients. One SPS patient was included in each assay as a positive control for enzymatic inhibition. Results are reported as a percentage (median and range) of maximum GAD65 enzymatic activity. Significant differences are indicated as p-values.

