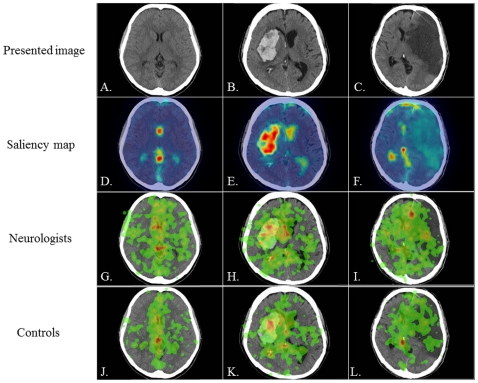
Figure 1. The presented images (images 1–3), saliency maps, and heat maps.
A–C: the three CT images presented to subjects, D–F: saliency maps, G–I: heat maps in neurologists, J–L: heat maps in controls. Presented CT images are the normal brain (A: image 1), cerebral hemorrhage from the putamen (B: image 2), and cerebral infarction due to embolism (C: image 3). Saliency maps reveal that the most outstanding areas are the ventricles and cistern (D), the large hemorrhagic area (E), and the region of physiological calcification (F). Heat maps in neurologists and controls reveal that the most frequently fixated areas are similar between the two groups in images 1 and 2 but not in image 3; specifically, they are the ventricles and cistern in image 1 (G, J), the large hemorrhagic area in image 2 (H, K), and the ACA infarction area for neurologists and the region of physiological calcification for controls in image 3 (I, L).

