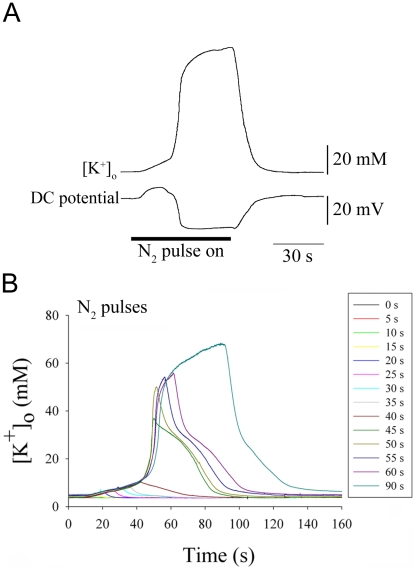
Figure 2. Sample traces of [K+]o surges in the fly brain during anoxia induced by exposure to N2 gas.
(A). 100% N2 gas was delivered through a porous polyethylene substrate. Flow timing and rate was controlled and the gas stream completely covered the animal. A single surge of [K+]o in the brain in response to a pulse of N2 recorded simultaneously with the extracellular DC potential. Three phases of [K+]o increase are evident (slow, fast and slow). (B). Surges of [K+]o in response to pulses of N2 that increased in duration from 5 s to 90 s (traces overlaid and aligned at the start of anoxia). Note that in this preparation durations of N2 exposure up to 40 s resulted in small increases of [K+]o that recovered quickly. Thereafter there was a surge of rapidly increasing [K+]o whose amplitude was dependent on the duration of N2 exposure until it reached a plateau that is not illustrated in this figure.

