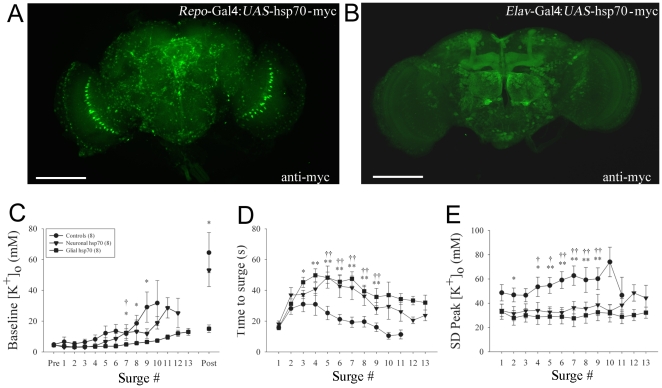
Figure 4. Tissue-specific expression of Hsp70 in glia but not in neurons mitigates the effect of repetitive anoxia on K+ homeostasis.
Repo-Gal4 (pan-glial) and Elav-Gal4 (pan-neuronal) were crossed with UAS-hsp70-myc flies. (A), Frontal aspect of a fly brain revealing the location of Hsp70-myc in glia when driven by Repo-Gal4. Note that glial cells distribute all over the brain tissues including the antennal lobes. The giant glial cells of the optic chiasm are arrayed in a semi-circular fashion in each optic lobe. (B), Neuronal Hsp70-myc (green) driven by Elav-Gal4. Note prominent staining in the neuronal axons of the mushroom bodies and in the neuropil of antennal lobes. (C), Comparison of the effects of repetitive anoxia on baseline [K+]o between surges in control flies (including Repo-Gal4 alone, Elav-Gal4 alone and UAS-hsp70 alone) and flies expressing Hsp70 in neurons (Elav-Gal4:UAS-hsp70) and in glia (Repo-Gal4:UAS-hsp70). (D), Effects of repetitive anoxia on time to surge. (e), Effects on peak [K+]o reached during exposure to repetitive anoxia.. Points represent three or more data points and are displayed as means ± standard error. Numbers in parentheses represent sample sizes. Asterisks indicate significant differences between control and glial expression; daggers indicate significant difference between control and neuronal expression (2-way RM ANOVA). One asterisk: P<0.05. Two asterisks: P<0.01. Scale bars in A and B = 100 µm.

