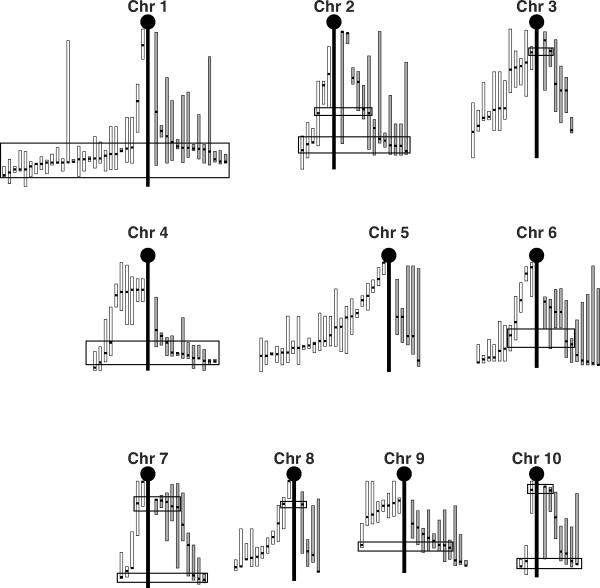
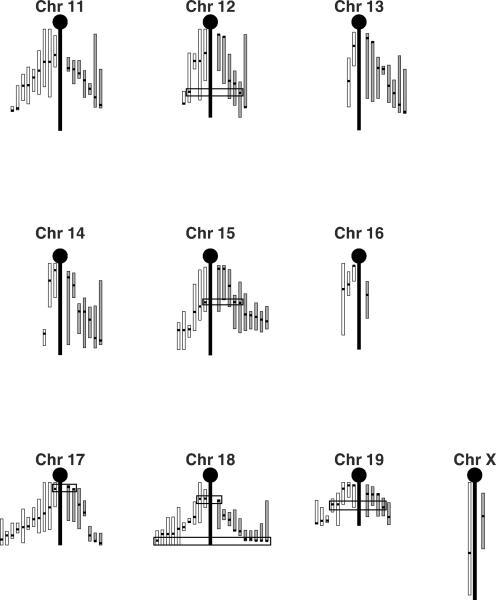
Figure 2. Quantitative trait loci (QTL) for HDL and BMD.
The literature was searched for the known HDL and BMD QTL mapped in mice [70–78]. In total 155 BMD QTL and 175 HDL QTL were identified. These QTL are plotted as follows: The central vertical black bar represents the chromosomal backbone. The HDL QTL are drawn on the left of the chromosome (white bars) and the BMD QTL are drawn on the right (grey bars). For each QTL, the peak location is indicated by a horizontal thick black tick mark and the vertical white or grey bars represent the 95% confidence intervals (CI). The CI are presented to scale using the literature listed CI when available. When no CI was listed, a conservative 20 cM interval was drawn to each side of the peak location, or to the top or bottom of the chromosome if that was closer. Black rectangles highlight locations of concordant peak locations when comparing the HDL and BMD QTL. For chromosomes for which there is little agreement among the crosses with regards to peak location for HDL (i.e. Chromosome 5), no attempt to identify concordant BMD-HDL QTL peaks was made.


