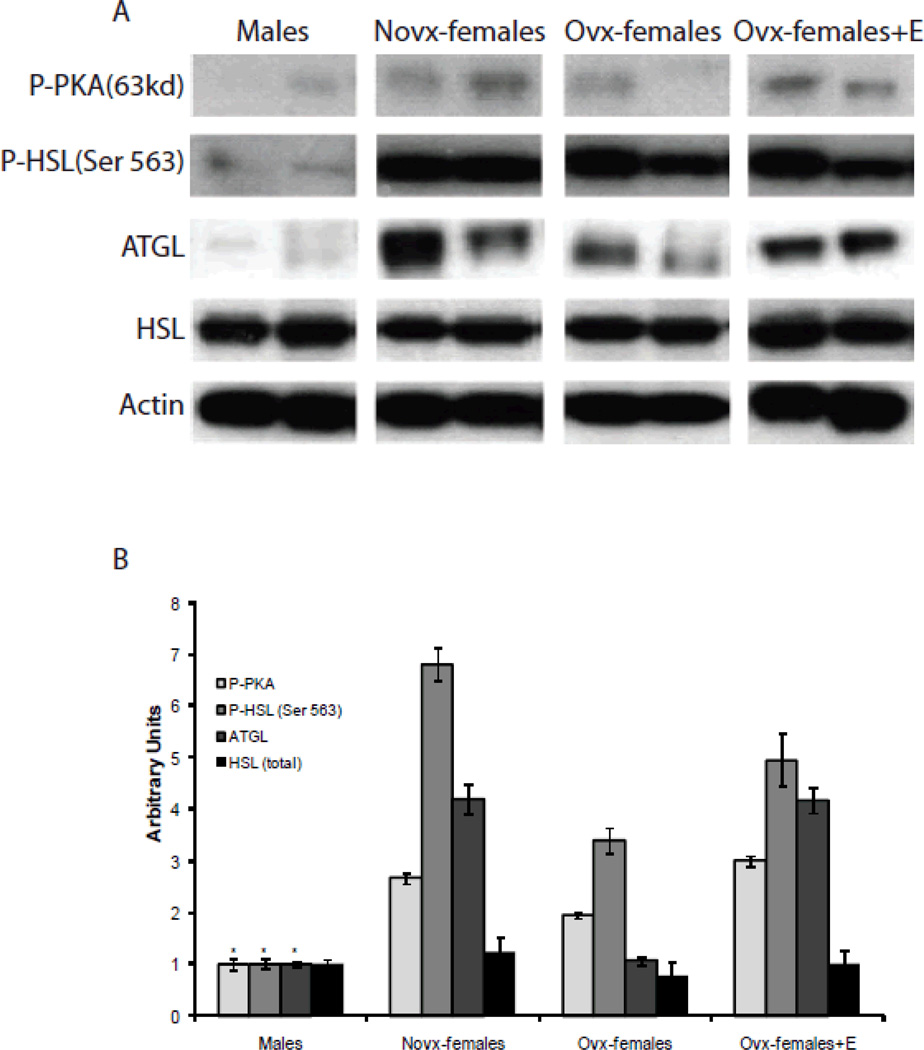
Figure 5. Sex differences in lipolysis.
Panel A: Adipose tissue was collected from the perigonadal fat pad and 30µg of protein was extracted for western blot analysis. Images represent 3 independent experiments (n=6). Panel B: Images were quantified using Image J. * Significantly different compared to novx-female and ovx-female+E, p<0.05 (n=6)

