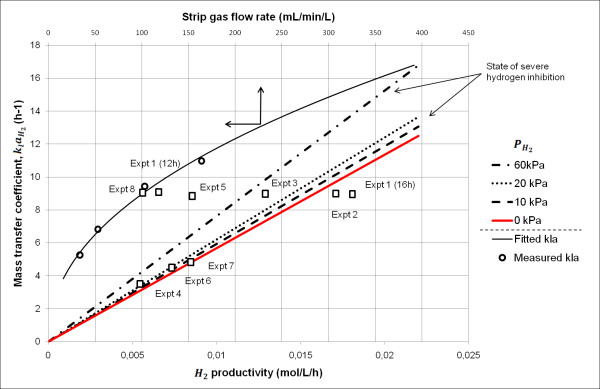
Figure 10.
State of severe hydrogen inhibition as a function of hydrogen productivity, and . The straight lines show the combinations of H2 productivity, and , resulting in a state of severe H2 inhibition. The state of severe H2 inhibition is assumed to occur at a value of H2aq equal to 80% of H2aqcrit (corresponding to a reduction in the growth and H2 production rate of 37%). The further away from, and above, the lines the state of a fermentation experiment is, the lower the inhibition by H2. An increase in H2 productivity and a decrease in move the state of the fermentation to the right and down, respectively, on the graph, while an increase in increases the slope of the lines. These changes all increase the dissolved H2 concentration and move the state of a fermentation experiment closer to a state of H2 inhibition. The open squares show the state of each experiment at the time of maximum productivity. An additional point is included for experiment 1 (12 hours), showing the state four hours before maximum productivity occurred. The curved line shows the relation between the stripping rate and (the relation given by equation 27). The experimental values (calculated from experimental values of using equation 25) are also included (open circles).

