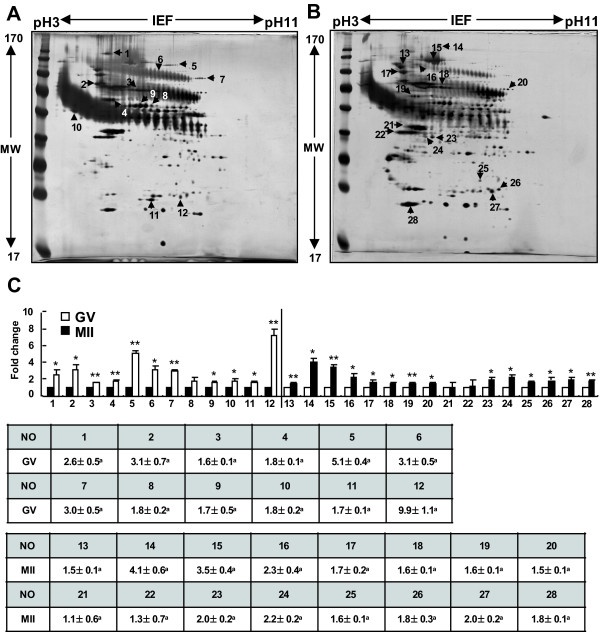
Figure 2.
Two-dimensional protein gels of GV- and M II-stage porcine oocytes. The proteins were separated using 2-DE gel electrophoresis, with the first dimension involving an 18-cm pH 3-11 NL IPG and the second dimension involving 10% gels (A: GV; B: MII), and visualized by silver staining. (C) Comparison of spot intensity in the 2-DE gels for the GV and MII-stage oocytes using quantitative analysis. The results, which were analyzed by the Phoretix Expression software, are presented in a bar graph *Value significantly differs from the control (*P < 0.05 and **P < 0.01). The numbered spots were identified by mass spectrometry, and the numbers correspond to their respective proteins in Tables 1 and 2.

