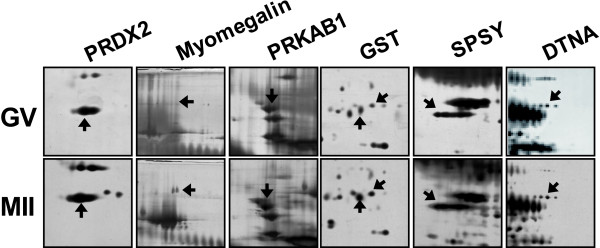
Figure 5.
Enlarged images of protein spots differentially expressed between the GV and M II stages. (A) The PRDX2, myomegalin, PRKAB1, GST, SPSY and DTNA proteins were up-regulated in the M II stage when compared with the GV stage. (B) Quantitative analysis of the expression levels of these proteins. The numbered spots were identified by mass spectrometry, and the numbers correspond to their respective proteins in Tables 1 and 2.

