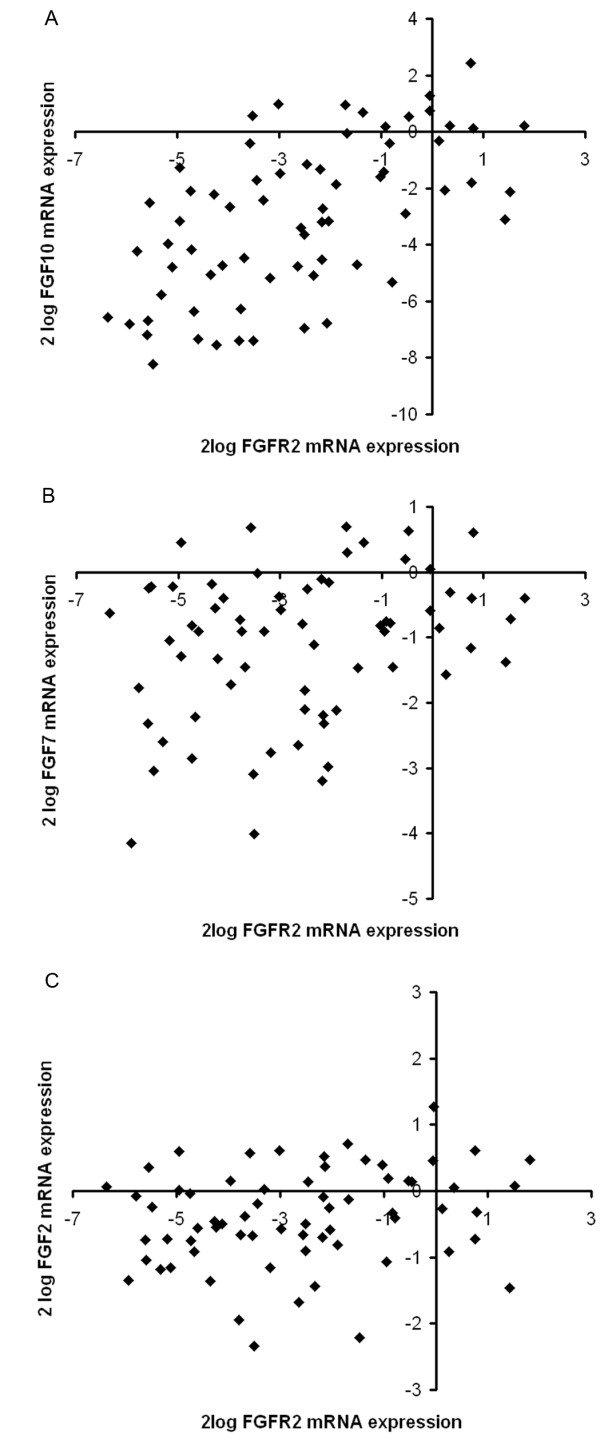
Figure 3.

Correlation of expression levels of FGFR2 and FGF10 mRNA in 68 skin fibroblast cultures. No correlation was found for FGFR2 and FGF2 mRNA or FGFR2 and FGF7 mRNA levels. The data were normalized to HNRPM and TBP and log2-transformed. Each dot represents the expression levels from one patient. (A) FGFR2 and FGF10 (P = 8 × 10⁻⁸; Pearson's correlation). (B) FGFR2 and FGF7 (P = 0.02; Pearson's correlation). (C) FGFR2 and FGF2 (P = 0.07; Pearson's correlation).
