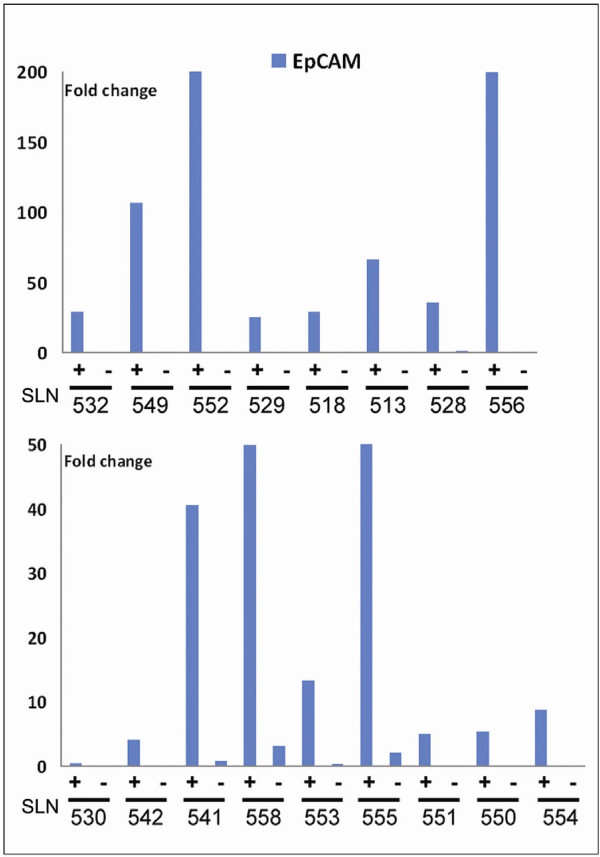
Figure 6.
EpCAM-IMS enriched for EpCAM RNA expressing cells. EpCAM expression was significantly increased in EpCAM-IMS enriched cell populations compared with the corresponding EpCAM depleted cell fraction. This applied to both EpCAM+/hMAM+ cell populations (upper panel) and to EpCAM+/hMAM- cell populations (lower panel). Note that the scale is different, reflecting the generally lower expression level of EpCAM in EpCAM+/hMAM- cells compared with the EpCAM+/hMAM+ populations. To fit the graphs the value for sample 552+ has been set to 200 (actual value 605), while 555+ has been set to 50 (actual value 70). Fold change is calculated relative to the average expression of EpCAM in all samples.

