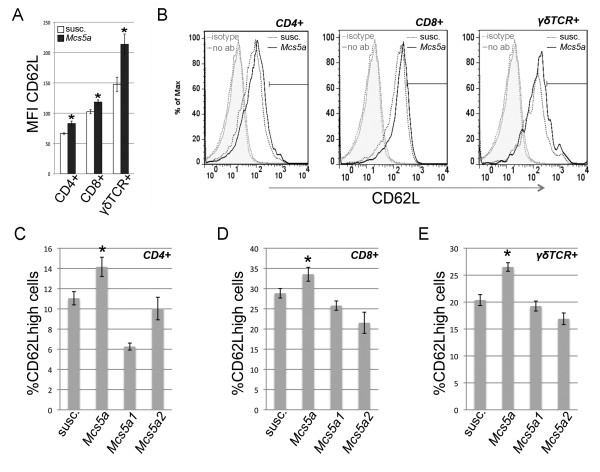
Figure 4.
Mcs5a increases the CD62Lhigh population among CD4+, CD8+, and γδTCR+ splenic T cells. (a) CD62L mean fluorescence intensities (MFIs) of the splenic CD4+, CD8+, and γδTCR+ T cells isolated from susceptible congenic control (open bars, n = 26) and Mcs5a-resistant congenic (filled bars, n = 29) rats. Significantly different (P < 0.05) CD62L expression is indicated by an asterisk. (b) Examples of overlaid flow cytometric histograms representing CD62L expression in CD4+, CD8+, and γδTCR+ T cells in susceptible congenic control rats (dotted black line) and Mcs5a-resistant congenic rats (solid black line). The grey dotted line and grey solid line represent fluorescence in the CD62L channel of an isotype control antibody-stained (isotype) and unstained (no ab) cell sample, respectively. The black bar represents the gate used to quantify the CD62Lhigh population in each T-cell subpopulation; the gate was set such that the MFI of the high population was fivefold that of the total cells. (c) Percentage of CD62Lhigh-gated cells among CD4+ splenic T cells. (d) Percentage of CD62Lhigh-gated cells among CD8+ splenic T cells. (e) Percentage of CD62Lhigh-gated cells among γδTCR+ splenic T cells. CD62Lhigh-expressing T cells of susceptible congenic control (susc., n = 26), Mcs5a-resistant congenic (Mcs5a, n = 26), Mcs5a1 susceptible congenic (Mcs5a1, n = 20), and Mcs5a2 susceptible congenic (Mcs5a2, n = 15) rat lines are shown. A significantly higher (P < 0.05) percentage of CD62Lhigh cells in the Mcs5a-resistant congenic line compared with the three susceptible congenic lines is indicated by an asterisk. Values in (a, c-e) are expressed as average ± standard error of the mean. Mcs5a, mammary carcinoma susceptibility locus 5a; TCR, T-cell receptor.

