Figure 3.
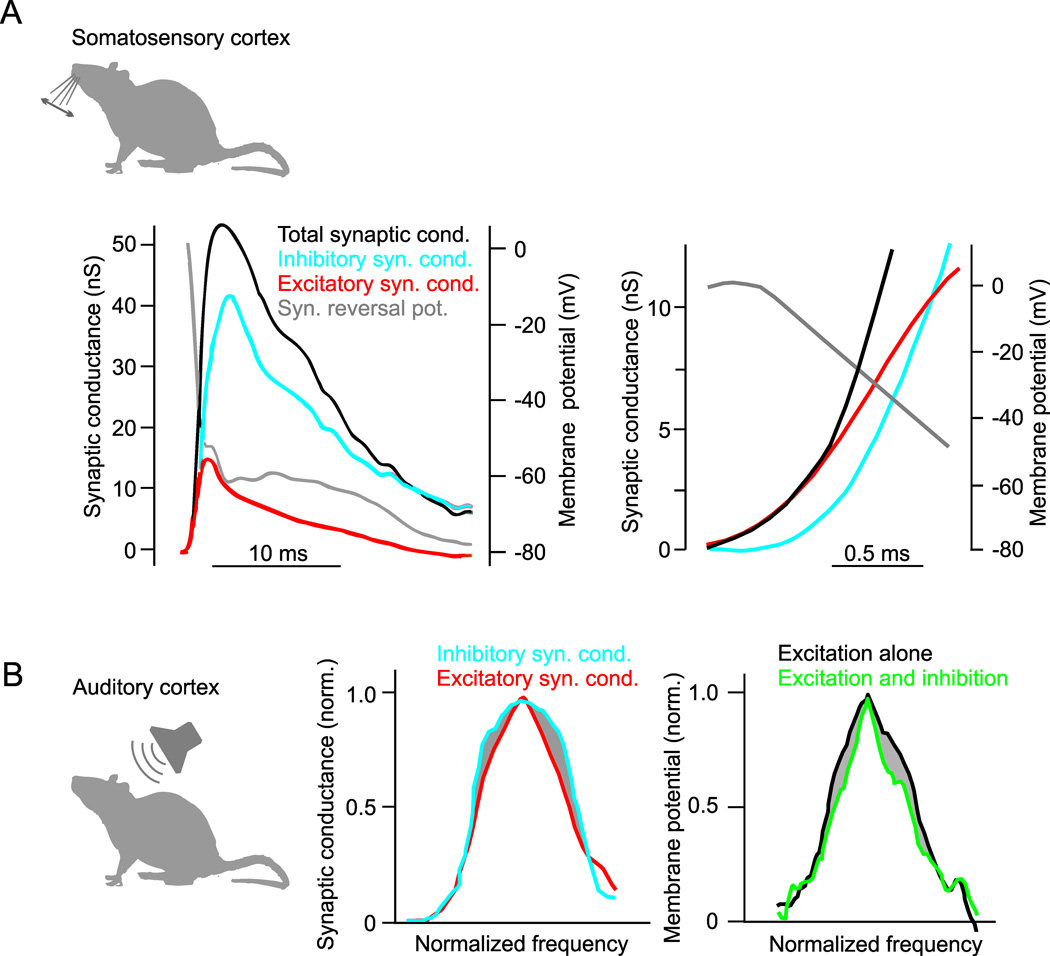
Dynamics and tuning of cortical excitation and inhibition. A, Intracellular recording of synaptic response to whisker deflection in rat somatosensory (barrel) cortex neuron. Left, Whisker deflection produces an increase in total synaptic conductance (black trace) that is composed of a rapid increase in excitatory conductance (red trace) and a delayed increase in inhibitory conductance (blue trace). The calculated reversal potential of the synaptic response (gray trace) reaches 0 mV (the reversal potential for glutamatergic excitation) immediately after the synaptic conductance begins to rise and becomes hyperpolarized (towards the reversal potential for GABA receptors) as the inhibitory conductance begins. Right, Same as left but on an expanded time-scale. Changes in reversal potential and conductances early in the response show that the onset of excitation precedes inhibition. Modified from (Higley and Contreras, 2006). B, Inhibitory sharpening of frequency tuning in rat auditory cortex. Left, Across a population of recorded cells, the average frequency tuning curve of tone-evoked inhibitory synaptic conductances (blue) is broader than the tuning curve of synaptic excitation (red). Right, Estimated membrane potential tuning curves derived from the same recordings show that inhibition causes a lateral sharpening of tone-evoked responses around the preferred stimulus frequency. Modified from (Wu et al., 2008).

