
Figure 4.
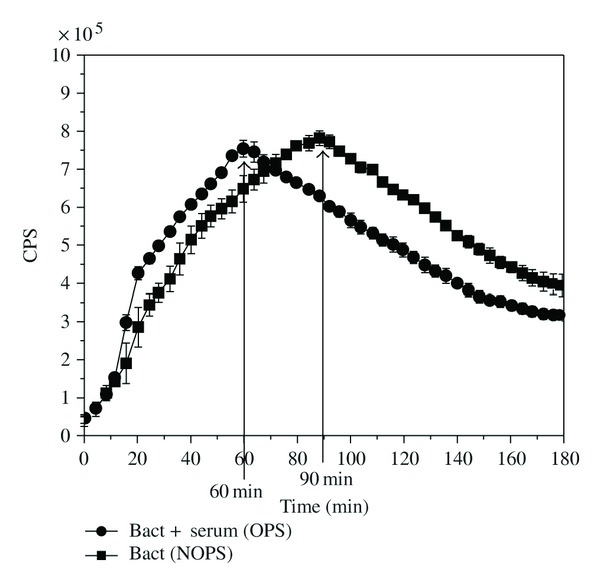
The luminol-amplified chemiluminescence (CL) signal of E. coli-lux (1 × 10⁶ cells) with 2.5 × 10⁵ neutrophils and 0.4% serum in gHBSS medium at 37°C. (●) bacteria + serum (OPS) and (■) bacteria (NOPS). Counts per second (CPS) values are shown as the mean ± SD of measurements from four parallel wells. Arrows point out the peak times of the CL signals.