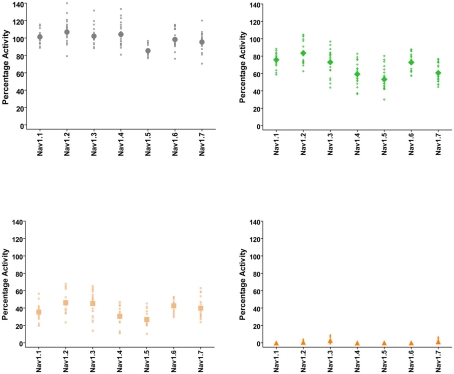
Figure 3.
Quality-control data for Nav1.1, Nav1.2, Nav1.3, Nav1.4, Nav1.5, Nav1.6, and Nav1.7 assays collected over a 6 month period of time using IonWorks Quattro. Vehicle control was external buffer with 0.3% DMSO final concentration and reference inhibitors consisted of tetracaine (Nav1.1), lidocaine (Nav1.2, Nav1.3, Nav1.4, Nav1.5, Nav1.6), and lamotrigine (Nav1.7). Data shown were calculated from Pulse 1 and Pulse 25 (as in Figure 2) and displayed as percentage activation relative to the ratio of Post-Compound/Pre-Compound pulses. Where 0.3% DMSO had no effect between the Pre-Compound and the Post-Compound pulses, this was defined as 100% activation. (Top left panel) vehicle control data. (Top right) data obtained at P1 with the IC50 concentration of inhibitor. (Bottom left) data obtained at P25 with the IC50 concentration of inhibitor. (Bottom right) data from P25 using an IC100 concentration of inhibitor. All data points are from cells with a minimum of 250 pA of current, and the mean is shown as the large filled symbol in each panel. The IC50 dose is chosen to estimate the block achieved at P25; since the compounds are state- and use-dependent blockers less than 50% block is frequently achieved at P1.

