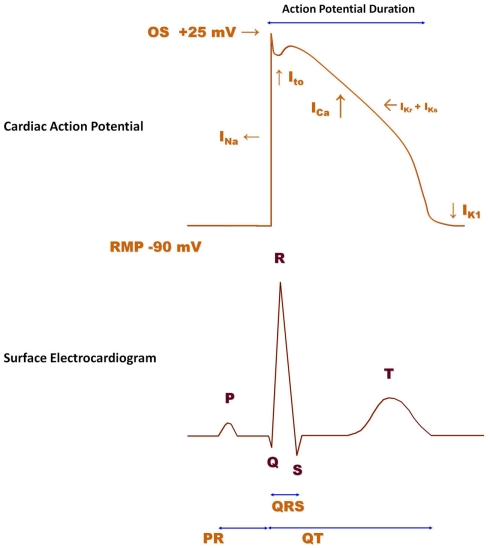
Figure 6.
Human ventricular action potential and surface electrocardiogram (ECG). The ventricular action potential (indicated in red) is determined by the activity of several ion channels. When the membrane potential reaches a threshold value, voltage-gated sodium channels (INa) rapidly activate and sodium ions enter the cell down their concentration gradient to cause cell depolarization. INa (Nav1.5), therefore, contributes to the upstroke of the action potential. Following depolarization, calcium channels (ICa; Cav1.2) open to allow calcium ions to enter the cell and initiate the excitation–contraction coupling mechanism. In order to bring the cell back to its resting state, different potassium channels, such as Ito (Kv4.2/Kv4.3), IKr (Kv11.1; HERG), IKs (Kv7.1/mink), and IK1 (Kir2.1) become engaged at different phases of the action potential. The action potential duration represents the time interval between the action potential upstroke and return to the resting level. The surface ECG (purple) is the sum of action potentials over all compartments of the heart. The P wave corresponds to atrial depolarization, whereas the QRS complex is caused by depolarization of the ventricle. The T wave corresponds to repolarization of the ventricle.

