Figure 3.

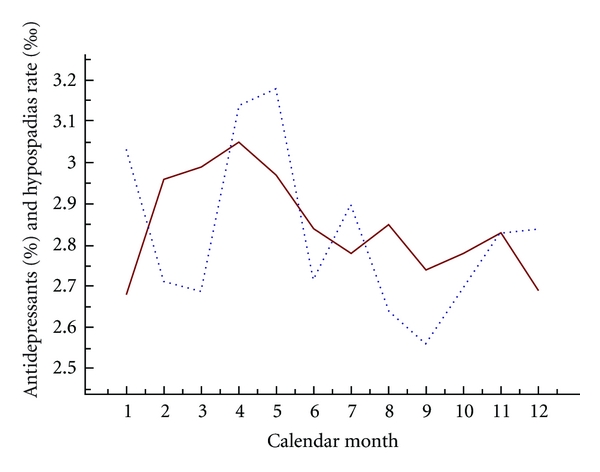
Rates of antidepressant use (percentage, unbroken line) and of hypospadias (per thousand, broken line) for the different calendar months.

Rates of antidepressant use (percentage, unbroken line) and of hypospadias (per thousand, broken line) for the different calendar months.