
Figure 3.
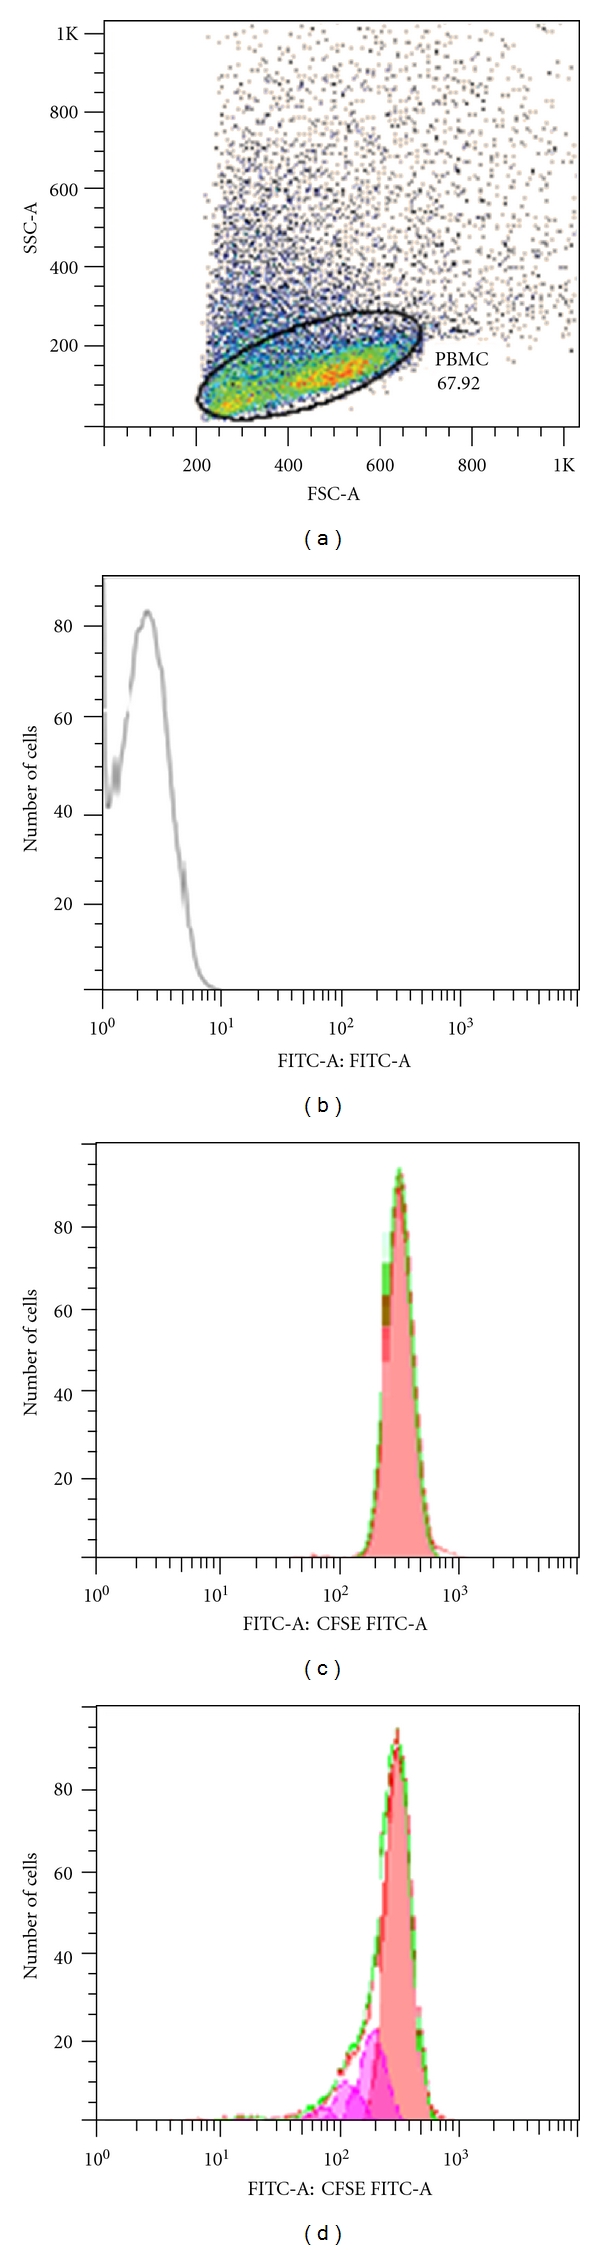
Flow cytometry profiles for evaluation of spontaneous proliferation of PBMCs by CFSE and analyzed by FlowJo software. (a) PBMCs selected for analysis. (b) Unstained cells. (c) An example of curves generated by CFSE-stained PBMC representing cells does not proliferate. (d) An example of curves generated by CFSE-stained PBMC represents proliferation. Each peak represents a cycle cell division. The curves generated by the CFSE profile were analyzed using the proliferation platform of the FlowJo software.