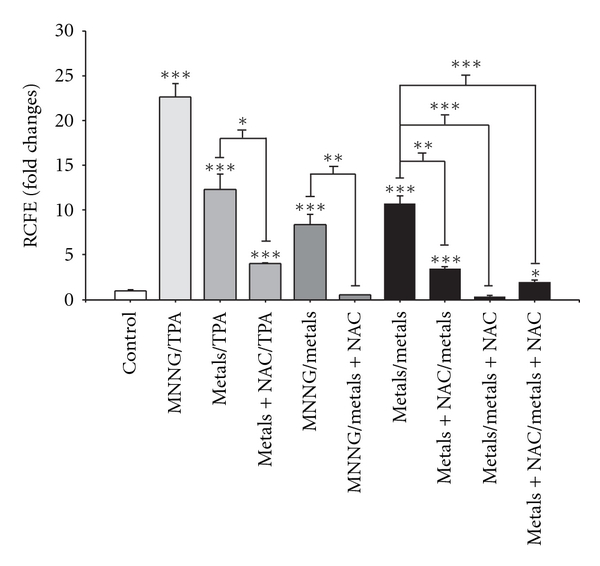
Figure 7.

Influence of N-acetyl-cysteine (NAC) on metal-mixture-induced transformation, number of transformation foci per dish. Cells were cotreated with 10 mM NAC and the metal mixture (2 μM NaAsO2, 2 μM CdCl2, and 5 μM Pb(C2H3O2)2·3H2O); samples were collected on day 25. Data represent the mean of three independent experiments performed in triplicate. Transformation is presented as the fold change with respect to control values. This value corresponds to the number of foci/dish in the experimental condition over the number of foci/dish in control samples. The results are presented as a percentage with respect to control values. ANOVA and Student's t-test *P < 0.05, **P < 0.001, ***P < 0.0001.
