
Figure 3.
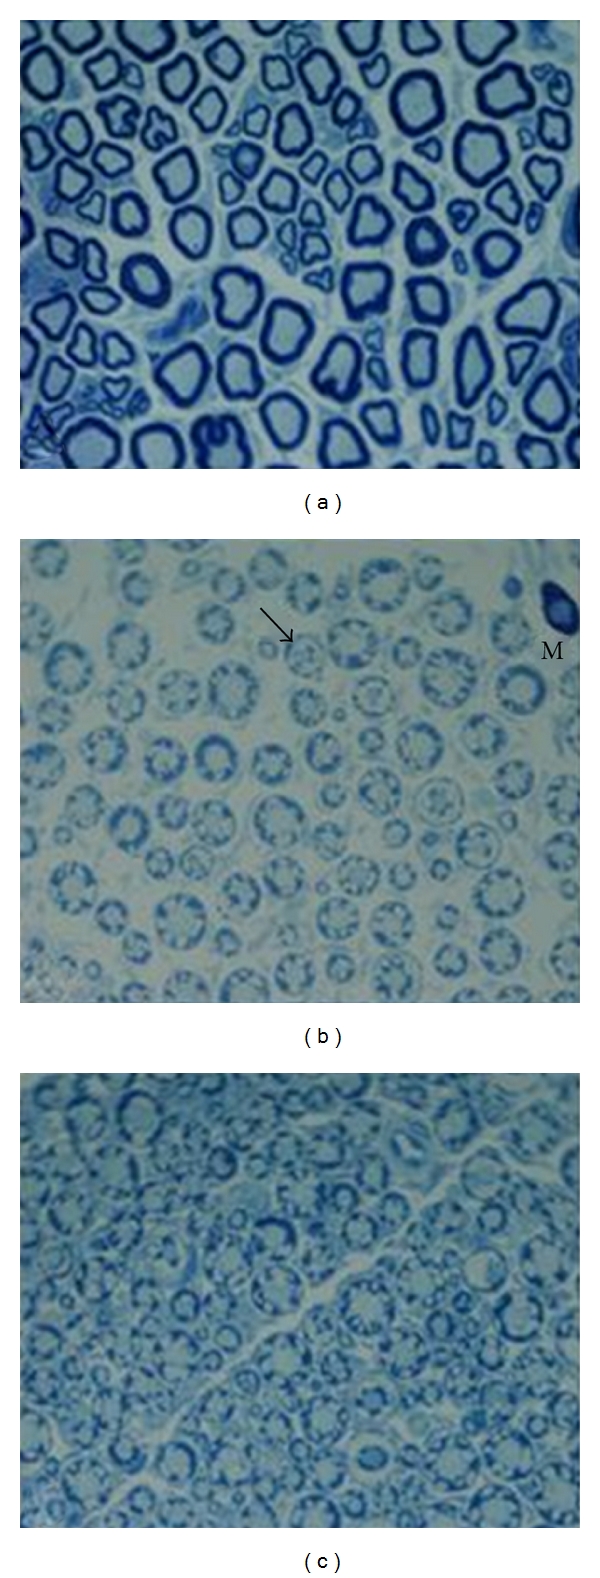
Light micrograph of transverse semithin sections of rat sciatic nerves. (a) Control group: myelinated nerve fibers are in normal structure and morphology. (b) Sham group: nerve fibers show some abnormalitities such as myelin splitting (black arrow), mast cell infiltration (M), and edema. (c) The DFE-treated group; the proportion of nerve fibers with abnormalities was reduced ×1000 (Toluidin blue staining).