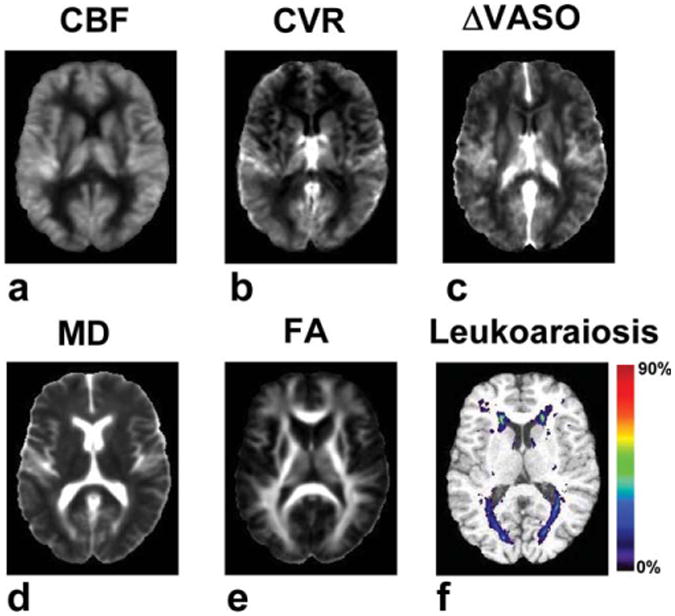
Figure 2.

Averaged parametric maps of CBF, CVR, ΔVASO, MD, and FA. All images were spatially registered to a brain template and then averaged. For the ΔVASO images, part of the occipital and frontal pole was missing in a few subjects due to incomplete brain coverage. For these regions the ΔVASO map was based on the data available for the location. An occurrence map of leukoaraiosis is also shown. For each voxel the probabilistic value was calculated by dividing the number of subjects having leukoaraiosis at the location by the total number of subjects (n = 33). [Color figure can be viewed in the online issue, which is available at http://www.interscience.wiley.com.]
