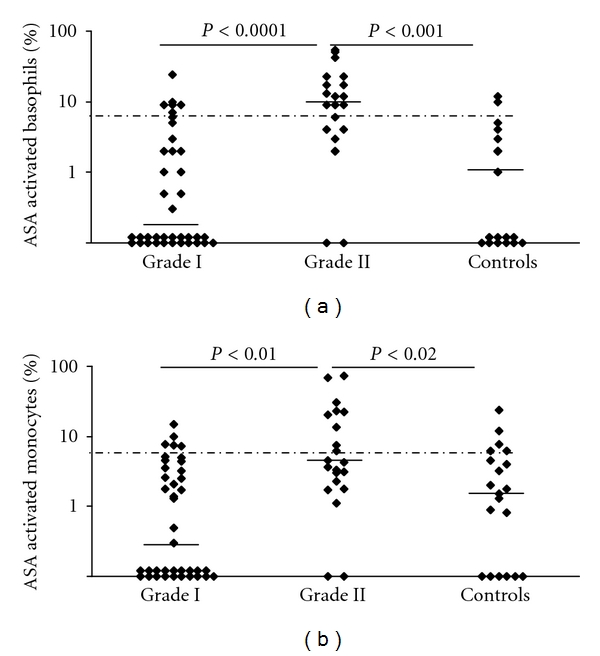
Figure 3.

Activation of patients' and controls' basophils and monocytes incubated with 1 mg/mL of ASA. (a) Basophils, (b) monocytes. Grading of reactions in the NSAID hypersensitivity was done according to severity of clinical symptoms [18] (Table 3). The median value is shown by the horizontal bold lines. The cut-off for a positive BAT or MAT was determined at 6% of activated cells (dashed line). Statistical analysis was performed by Wilcoxon's nonparametric test.
