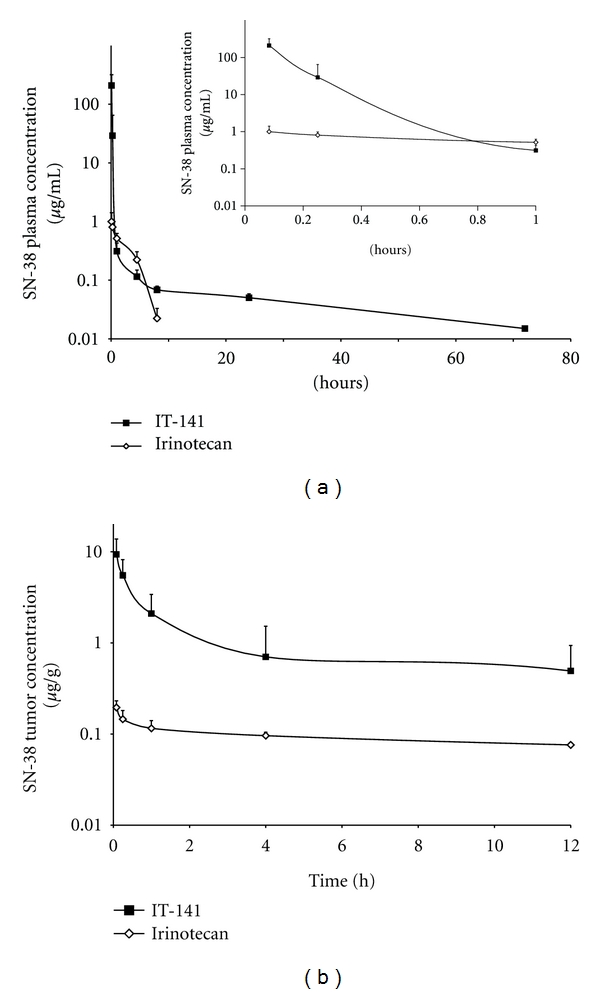
Figure 2.

Plasma and tumor pharmacokinetics of IT-141 compared to irinotecan. (a) HT-29 tumor-bearing nude mice (eight mice per group) were administered a single bolus intravenous injection of IT-141 or irinotecan at a dose of 30 mg/kg. (a) Plasma concentration of SN-38 compared to irinotecan plotted versus time. Inset: plasma concentrations plotted from 5 min to 1 hour. (b) Tumor concentration of SN-38 compared to irinotecan plotted versus time. Values are presented as mean ± standard deviation.
