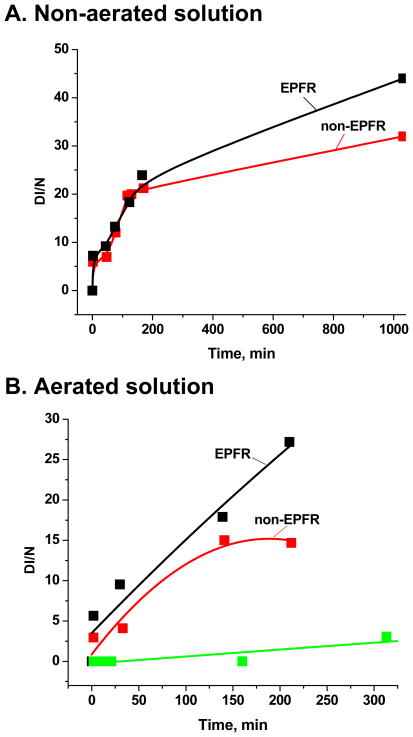
Figure 2.
A. The time evolution of the EPR signal intensity of DMPO-OH for the non-aerated control (red) and sample (black) solutions. B. The time evaluation of the EPR signal intensity of DMPO-OH for the aerated control (red) and sample (black) solutions. The green line represents the time evaluation of the EPR signal intensity of DMPO-OH for pure DMPO (150 mM) in 200 μL PBS solution and indicates no statistical increase in DMPO-OH concentration.

