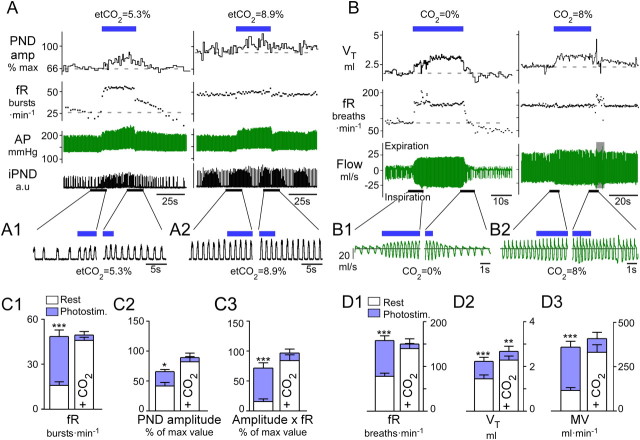
Figure 1.
Breathing stimulation elicited by photostimulation of RTN Phox2b neurons is occluded by hypercapnia. A, Urethane-anesthetized, vagotomized, and ventilated rat. Left, Normocapnia (etCO2, 5.3%). Right, Hypercapnia (etCO2, 8.9%). RTN photostimulation (20 Hz, 5 ms pulses) is indicated by the blue bar. Under normocapnia, respiratory frequency, fR, increased within seconds to a steady-state level >50 bursts · min−1 and decayed in a two-step fashion (rapid, then slow) upon cessation of the stimulus. Phrenic nerve discharge peak amplitude, PNDamp, progressively increased during the stimulus and also had a slow decay upon cessation of the stimulus. During hyperoxic hypercapnia (right) the same stimulus produced no further increase of fR, a lesser increase in peak amplitude, but an identical increase in arterial pressure (AP). B, Conscious rat in flow-through, whole-body plethysmography chamber. Left, Hyperoxic normocapnia (100% O2); right, hypercapnia (8% CO2, balance O2). Continuous RTN stimulation (23 Hz, 3 ms pulses, 30 s total duration, blue bar) raised breathing frequency, fR, and tidal volume, VT, with identical onset kinetics as that in the anesthetized rat. Following the end of the stimulus, fR and VT dropped precipitously below baseline in the conscious rat, presumably because of hyperventilation-induced hypocapnia. During hyperoxic hypercapnia (right), RTN photostimulation produced a small increase in VT but no increase in fR. A1, A2, B1, B2, Expanded traces highlighting the periods surrounding the beginning and end of the stimulus. Note that in plethysmography records, inspiration is downward. C, Group data for anesthetized rats. From left to right: C1, fR; C2, PND peak amplitude; and C3, double product (fR × PND amplitude) at normal (left columns) and elevated CO2 (right columns). D, Group data for conscious rats. From left to right: D1, fR; D2, VT; and D3, double product MV, minute volume, at normal (left columns) and elevated CO2 (right, 8% CO2 in pure oxygen). *** p < 0.001, **p < 0.01, *p < 0.05 between prestimulus baseline and peak values during the stimulation period; two-way ANOVA with multiple comparisons.

