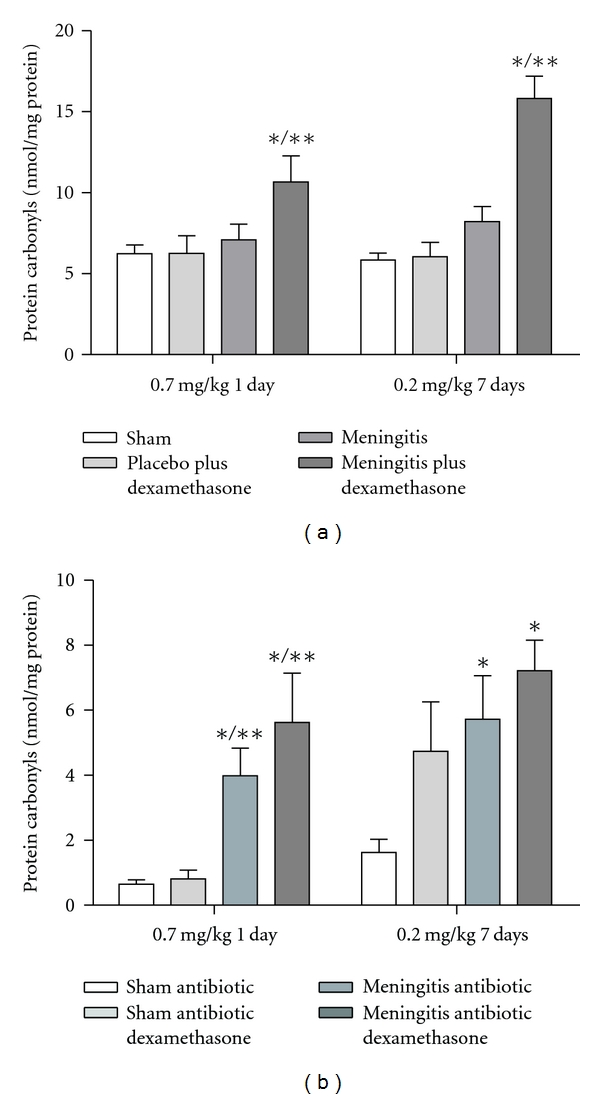
Figure 3.

Protein carbonyl. The protein carbonyls was evaluated in the hippocampus (a), and cortex (b), during the treatment with dexamethasone (0.7 mg/kg/1 day or 0.2 mg/kg/7 days). Values are expressed as mean ± SD (n = 5 for each group). *Different from sham (P < 0.05), **different from sham with dexamethasone.
