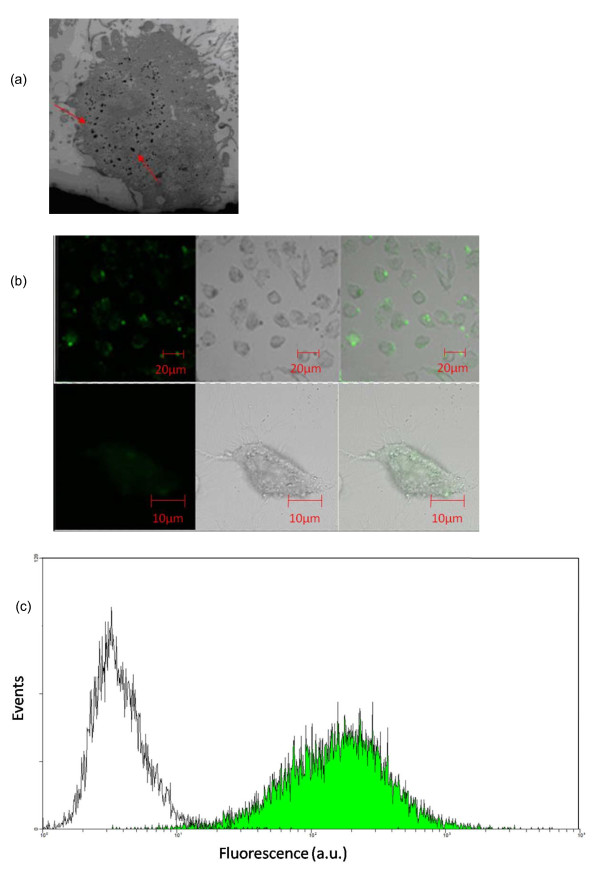
Figure 4.
TEM and confocal microscopy images and flow cytometry analysis of HeLa cells. (a) TEM photograph of HeLa cells treated with f-HNT-ASODN-FAM complexes. (b) Confocal laser scanning microscopic images of the f-HNT-ASODN complexes with HeLa cell uptake (FAM fluorescence was used to label ASODNs; left), bright image (middle), and merged image (right). HeLa cells were taken after a 4-h long incubation with the f-HNT-ASODN complexes at 37°C, 5% CO2, and 95% relative humidity. (c) Flow cytometry of cells incubated with f-HNTs-ASODNs-FAM (green area) as compared with unlabeled cells (white area), demonstrating that almost each cell has been transfected. After washing, the cells were analyzed by flow cytometry. Fluorescence was detected from the FAM fluorescent material tagged on ASODNs.

