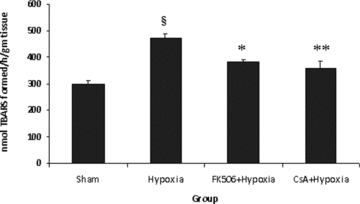
Figure 3.

Rate of lipid peroxidation (LPO) in different groups. Values are expressed as mean ± SE (n = 6). Significant difference §P < 0.001 when compared with sham; *P < 0.01, **P < 0.001 when compared with hypoxic group. Hypoxia resulted in significant increase (P < 0.001) in LPO, which was significantly decreased by the treatment of FK-506 and CsA in hypoxic group. Both the drugs showed the same LPO-lowering effect.
