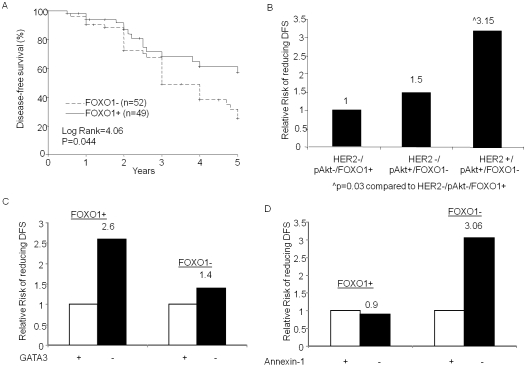
Figure 2.
DFS and FOXO1 expression. (A) Kaplan-Meier survival curves were used to compare the 5-year DFS between the FOXO1 positive and negative tumors. The differences between the curves were estimated by log-rank test and p<0.05 was considered statistically significant. (B to D), The RR of shorter DFS was determined by univariate Cox regression analysis. (B) The patients were grouped as (I) HER2-/pAkt+/FOXO1-, (II) HER2+/pAkt+/FOXO1- and (III) HER2-/pAkt-/FOXO1+ tumors. The RR was compared to (III) HER2-/pAkt-/FOXO1+ group. (C and D), The patients were first grouped as FOXO1-positive and FOXO1-negative and then RR of shorter DFS in GATA3-negative tumor was compared with that in GATA3-positive tumor in each group (C); or Annexin-1-negative tumor was compared with Annexin-1 -positive tumor (D) in each group. p<0.05 was considered statistically significant only.

