
Figure 4.
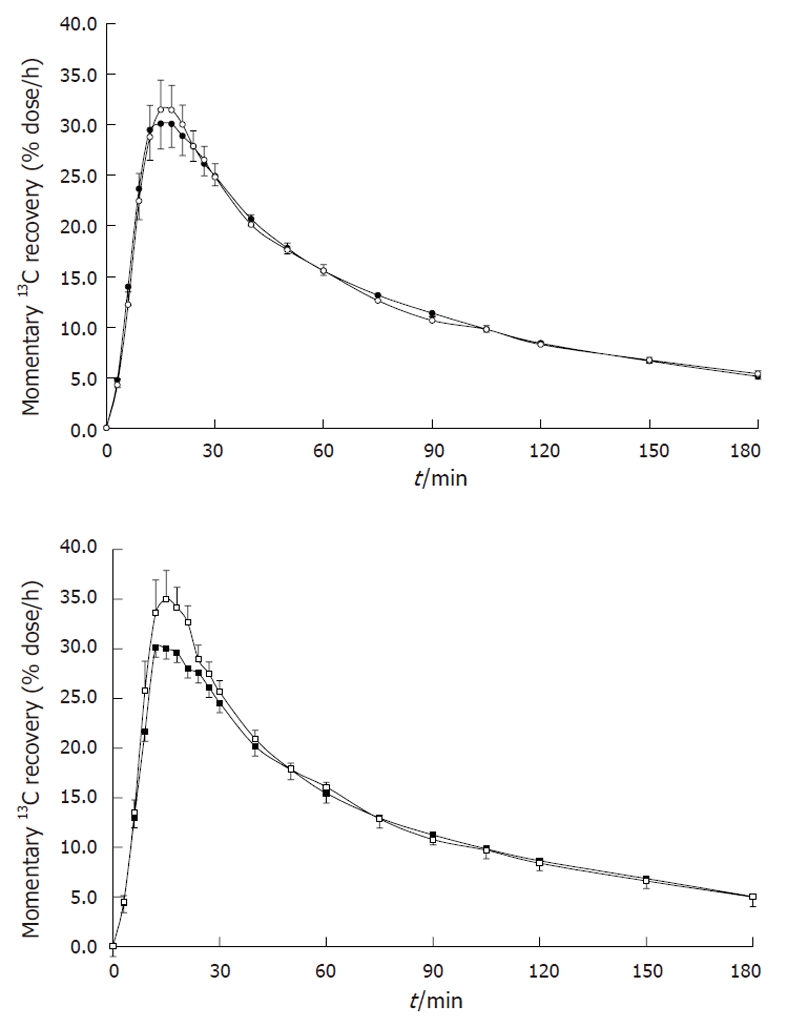
Corresponding curves of the momentary 13C recovery in breath air after peroral administration of 75 mg 13C-methacetin in 20 healthy volunteers if two examinations were taken at a median of 2 d apart (panel A) or if the examinations were separated by a median 18 d gap (panel B). Open symbols, the first administration, filled symbols, the second administration, the values shown are mean ± SE. See the text for the results of the statistical comparison of the matching Dmax and AUC0-60 values.