Figure 2.
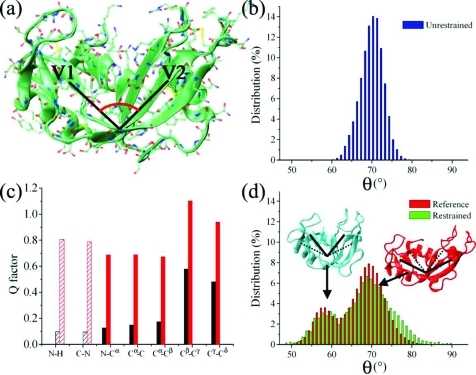
Determination of large-amplitude structural fluctuations from RDCs. (a) Representation of the structure of RNase A (Protein Data Bank code 7RSA [32]); the pincer angle, which accounts for the large motions between the antiparallel β-sheets V1 (residues 61–63, 71–75, 105–111, and 116–12) and V2 (residues 42–46, 82–87, and 96–101), is indicated schematically. The value of the pincer angle is calculated from the three centers of mass of the Cα-atoms of three protein regions: region 1 (V2) spanning residues 42 and 43, region 2 (hinge) spanning residues 48, 49, and 80, and region 3 (V1) spanning residues 72 and 73. (b) Pincer angle distribution in 100 ns unrestrained Amber99SB simulations. (c) Agreement (Q factor) between RDCs of the reference and restrained ensembles (black) and the reference and unrestrained ensembles (red); dashed lines indicate bond vectors employed as restraints. (d) Pincer angle distribution in the reference (red) and restrained (green) ensembles calculated with three alignment media and 16 replicas (Figure S6, Supporting Information); the bimodal distribution includes both closed (blue) and open (red) conformations. Thirty structures per replica are recorded in the final part of each cycle (sampled at 300 K) of the restrained ensemble with a total of 9600 conformations.

