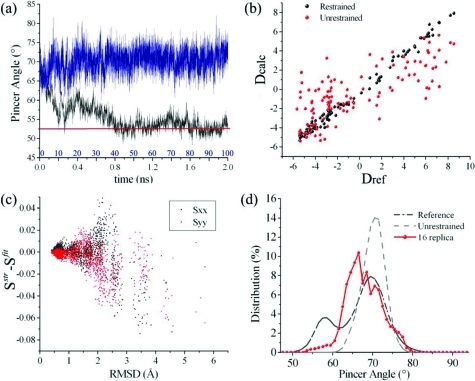
Figure 3.
Structural accuracy of the RDC-driven sampling. (a) Time series of the pincer angle in the 100 ns unrestrained (Amber99SB) simulations (blue line) and 2 ns restrained (Amber99SB) simulations (black line), enforcing RDCs calculated from a closed structure of RNase A; the restraint force is gradually enforced during the first 1 ns. The red line indicates the angle value of the target structure. (b) Comparison between the RDCs of the target closed structure (Dref), of the structures obtained in the last 1 ns of the restrained simulations (Dcalc, black dots), and of the structures selected from the unrestrained simulations (Dcalc, red dots). (c) Principal elements of the alignment tensors as a function of the rmsd between conformations extracted from the restrained simulation and the target structure from which the RDCs have been calculated; the plot shows the differences between fitted (Sfit) and structure-based alignment (Sstr) tensors. (d) Comparison of the distribution of the pincer angle in the restrained ensemble obtained using only one steric alignment medium and 16 replicas (red) with the distributions from the reference (black dot-dashed) and unrestrained (gray dashed) ensembles.

