
Figure 2.
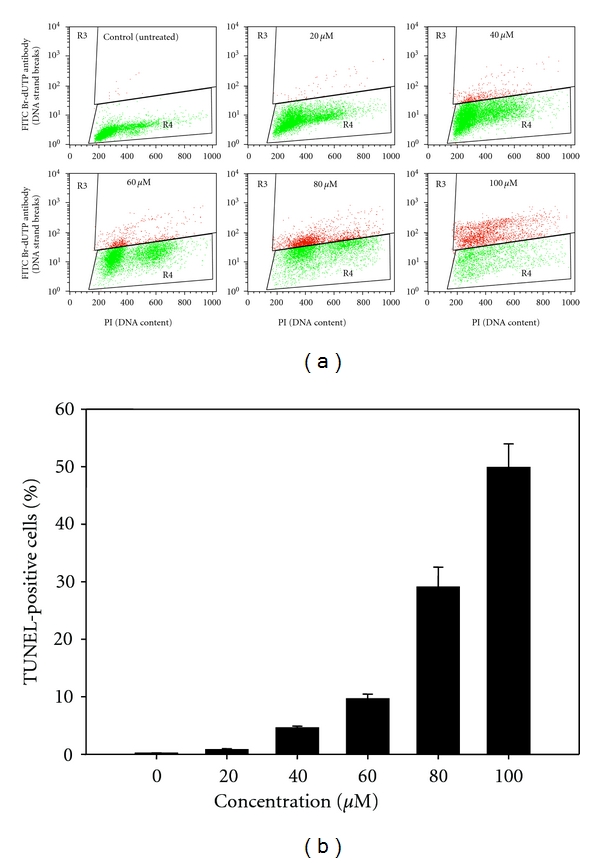
Effect of MAA on fragmentation of DNA in Ca Ski cells. Cells were exposed to different concentration of MAA for 24 h and proceeded to TUNEL assay as described in Section 2. (a) Representative dual parametric dot plots of PI (DNA content) on the x-axis and FITC Br-dUTP antibody (DNA strand breaks) on the y-axis. The gated R3 regions (red) indicate TUNEL-positive cells. (b) Bar chart shows the percentage of TUNEL-positive cells. Values are mean ± S.E. from three experiments.