
Figure 5.
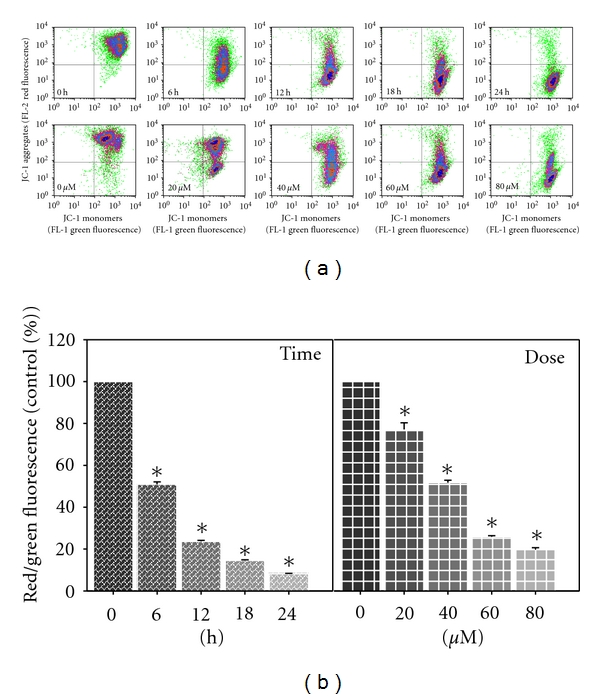
Effect of MAA on mitochondrial membrane potential (Δψm) in Ca Ski cells. Cells were treated with 60 μM of MAA for different time points. At 12 h of treatment, cells were treated with different concentration of MAA. After treatment, the cells were stained with JC-1, and the change in Δψm was analyzed by flow cytometry as described in Section 2. (a) Representative dot plots of JC-1 aggregates (FL-2 red fluorescence) versus JC-1 monomers (FL-1 green fluorescence). (b) Bar charts showing the ratio of red/green fluorescence, expressed as percentage of control, indicate the ratio of high/low Δψm. Values are mean ± S.E. of three experiments. Asterisks indicate a significant difference between untreated and treated cells (*P < 0.05).