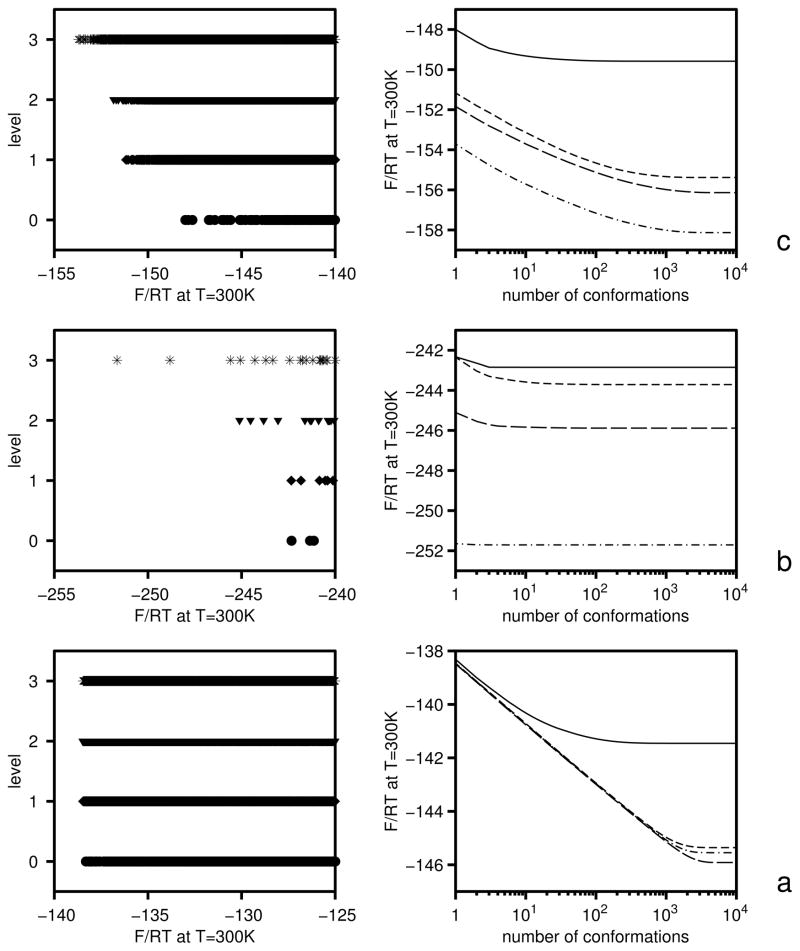
Fig. 3.
Illustration of the role of inclusion of the Shannon-entropy term in eq 25 in the last iteration of the optimization of the force field using 1GAB as the training protein (section 4.2). Left panels: linear plots of the dimensionless free energies (U/RT − ln ω) at T = 300 K (with ω defined by eq 15) of the conformations of the 1GAB protein at level 0 (filled circles), 1 (filled diamonds), 2 (filled triangles), and 3 (asterisks); the symbols are seen most clearly in panel b. Only the low-free-energy parts are shown for clarity, and the F/RT span is the same on all three panels for better comparison. Right panels: plots of partial dimensionless free energies calculated by taking only the N lowest-free-energy conformations (where N is the variable of the abscissa) sorted according to U/RT − ln ω. Solid lines: level 0; short-dashed lines: level 1; long-dashed lines: level 2; dash-dotted lines: level 3. (a) Before minimizing the target function, (b) After minimizing the target function without including the Shannon-entropy term. (c) After minimizing the target function with inclusion of the Shannon-entropy term.

