Figure 2.
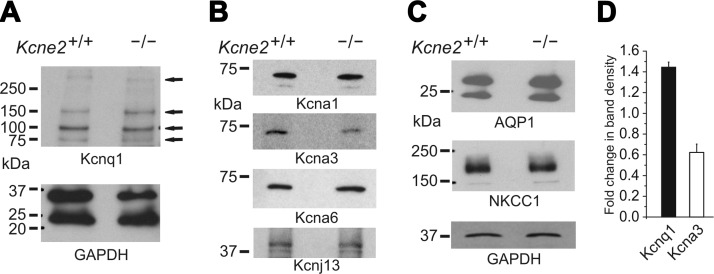
Expression of K+ channels, AQP1 and NKCC1, in the CPe of Kcne2+/+ and Kcne2−/− mice. A) Western blot of mouse CPe cell lysates, using anti-Kcnq1 antibody (top) and corresponding blot for anti-GAPDH antibody as a loading control (bottom). Arrows represent bands corresponding to expected weights for various multimeric forms of Kcnq1. Representative of n = 3 experiments, each using either pooled choroid plexus lysates with the nuclear fraction removed by centrifugation from 20 mice/genotype or whole choroid plexus lysate from individual mice (as in the blot shown here; hence, 2 bands are observed for GAPDH, corresponding to nuclear and cytosolic forms of GAPDH). B, C) Western blots of mouse Kcne2+/+ and Kcne2−/− CPe cell lysates, using commercial antibodies raised against the various ion channel α subunits (B) and transporters (C) shown and GAPDH as a loading control. Representative of n = 3 experiments, each using pooled choroid plexus lysates with nuclear fraction removed by centrifugation from 20 mice/genotype (as in the blot shown here; hence, a single band for GAPDH corresponding to the cytosolic form only) or whole choroid plexus lysate from individual mice. D) Mean fold change in band density for Kcnq1 (n=3) and Kcna3 protein (n=4) in Kcne2−/− vs. Kcne2+/+ CPe cell lysates (i.e., effect of Kcne2 deletion). Error bars = se.

