Figure 1.
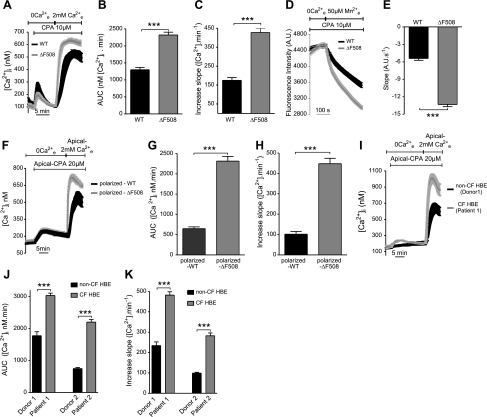
SOCE is enhanced in CF hAECs. [Ca2+]i was measured using the Ca2+ probe Fura-2. A) Time course of [Ca2+]i when cells were exposed to CPA (10 μM) in Ca2+-free saline to deplete intracellular stores and Ca2+ was added back to the extracellular medium. Calcium readdition produced a much larger Ca2+i increase in CFBE-ΔF508 cells (gray trace, n=78 cells) compared to -WT cells (black trace, n=71 cells). B, C) AUC calculated during the first 5 min after readding Ca2+e to CFBE-WT (black bar) and -ΔF508 (gray bar) cells with depleted stores (B), and slope calculated during the first minute of Ca2+ entry in CFBE-WT (black bar) and -ΔF508 (gray bar) cells (C). Data are means ± se of 86 WT and 113 ΔF508 cells. D) Representative experiment showing the time course of Mn2+ quenching after depleting stores in CFBE-WT (black trace) and -ΔF508 (gray trace) cells. E) Rate of net influx into CFBE-WT (black) and -ΔF508 (gray) cells after store depletion. Data are means ± se of 41 WT and 52 ΔF508 cells. F) SOCE is enhanced in polarized monolayers of cells expressing ΔF508- (gray trace) compared to WT-CFTR (black trace). After ER store depletion by CPA application, a larger Ca2+i increase was observed in polarized CFBE-ΔF508 (gray trace) compared to -WT monolayers (black trace) when extracellular Ca2+ was present only on the apical side. G, H) AUC (G) and slope (H) in polarized CFBE-WT (black bar) and -ΔF508 (gray bar) monolayers. Data are means ± se of 25 WT and 10 ΔF508 cells. I) SOCE is also augmented in polarized CF-HBE (gray trace) compared to non-CF cells (black trace). J, K) AUC (J) and slope (K) in polarized non-CF (black bar) and CF-HBE (gray bar) monolayers. Data are means ± se of 6, 7, 3, and 3 culture inserts from donor 1, patient 1, donor 2, and patient 2, respectively.

